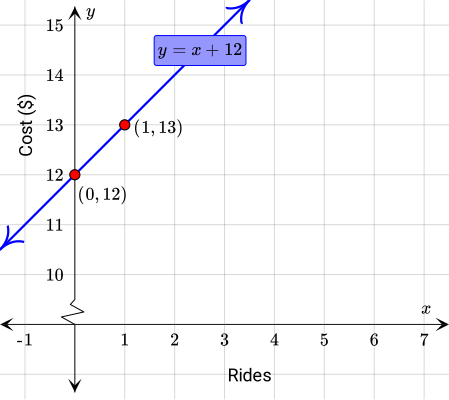
We want to graph the equation which is given in slope-intercept form.
y=x+12
We need to find the slope and the y-intercept of this equation. In general, an equation in slope-intercept form has a value m which is the slope of the line and a value b which is the y-intercept. Let's compare our equation with the general slope-intercept form to find our values of m and b.
y= mx+ b
↓
y= 1x+ 12
We see that the y-intercept of our equation is 12. This means that y=12 when x=0. Therefore the point (0,12) is on the line. We can also see that our equation has a slope of 1. This means that the value rises 1 unit when we run 1 unit to the right.
m=rise/run=1/1
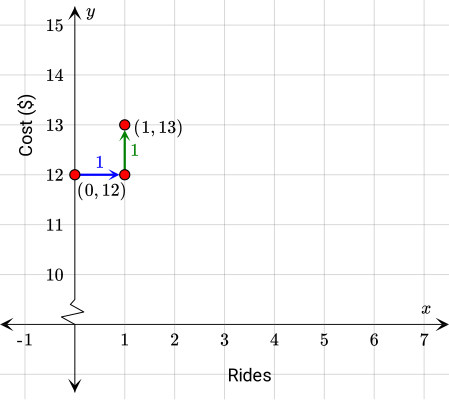
We can use this information to make a slope triangle and find another point on the line. We plot a point that is 1 unit right and 1 unit up from the y-intercept point, (0,12), and draw a line between them. Let's do this!
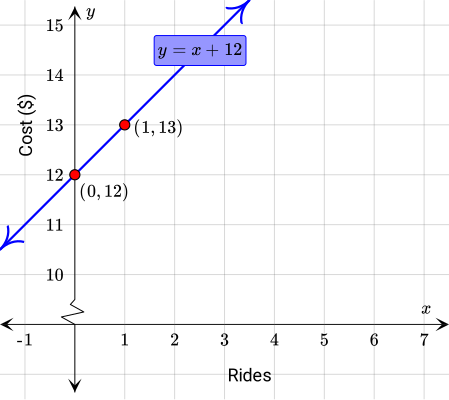
We found that the point (1,13) is on the line. Finally, we can draw the graph of the equation.
Let's think about what the y-intercept and the slope mean in the given context.
Interpretation
y-intercept
The admission to the fair with no rides included is $ 12.