Substituting values from the domain will give the corresponding values from the range.
Practice makes perfect
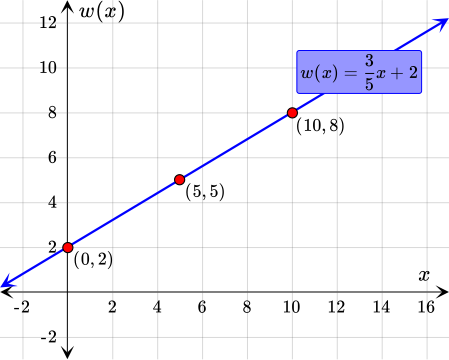
We can graph the linear function using a table. First, let's select some arbitrary values from the domain, then substitute them for x in the given function. Solving for w(x) will give us the corresponding values from the range.
x
w(x)=3/5x+2
Simplify
0
w( 0)=3/5( 0)+2
w(0)= 2
5
w( 5)=3/5( 5)+2
w(5)= 5
10
w( 10)=3/5( 10)+2
w(10)= 8
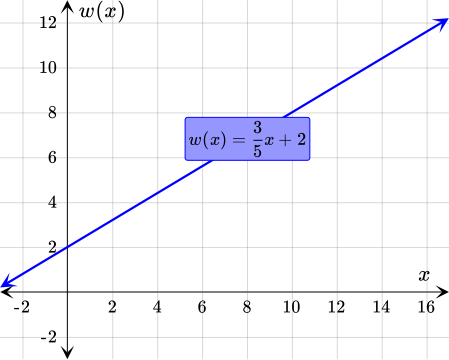
Using these x and w(x) values as ( x, w(x)) coordinate pairs, we can plot the points. Connecting these points will give us the graph of the function.