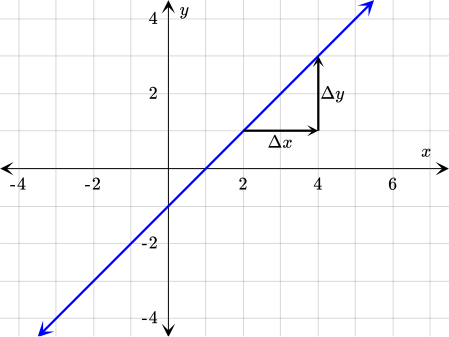
Using that line, the rate of change can be determined by finding the horizontal change Δx and the vertical change Δy between any two points on the line. Any function whose graph is not a straight line cannot be linear.
Recommended exercises
To get personalized recommended exercises, please login first.
Mathleaks uses cookies for an enhanced user experience. By using our website, you agree to the usage of cookies as described in our policy for cookies.