6. Comparing Linear, Exponential, and Quadratic Functions
Sign In
An error ocurred, try again later!
Chapter 9
6.
Comparing Linear, Exponential, and Quadratic Functions
In mathematics, understanding how different functions behave is vital. Linear functions exhibit a constant growth rate, which means they progress in a straight path. Quadratic functions, on the other hand, display a growth pattern that accelerates, often visualized as a curve. Exponential functions, arguably the most dynamic, show growth that doubles or even triples over time, indicating a steep upward trajectory. Understanding these differences allows professionals in fields such as economics, engineering, and natural sciences to model real-world scenarios accurately and make well-informed predictions.
Show less Show more expand_more 


Lesson Settings & Tools
| | 10 Theory slides |
| | 9 Exercises - Grade E - A |
| | Each lesson is meant to take 1-2 classroom sessions |
Many real-life situations, such as buying a cellphone, making an investment, or studying the population growth of a particular species, can be modeled using functions. This lesson will review some situations and identify whether they can be fitted into a linear, quadratic, or exponential function to make optimal decisions.
Catch-Up and Review
Here are a few recommended readings before getting started with this lesson.
Challenge
Share
Report error
Distinctive Characteristics of a Quadratic Function
The graphs of a linear function, a quadratic function, and an exponential function can be seen in the applet below.
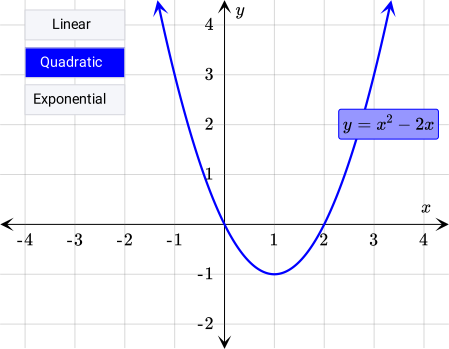 Is it possible to name at least three characteristics of a quadratic function that neither a linear nor an exponential function has?
Example
Share
Report error
Classifying Functions
Magdalena has just found an old printer toy she used to play with when she was a child. She discovered that the toy prints random functions as labels.
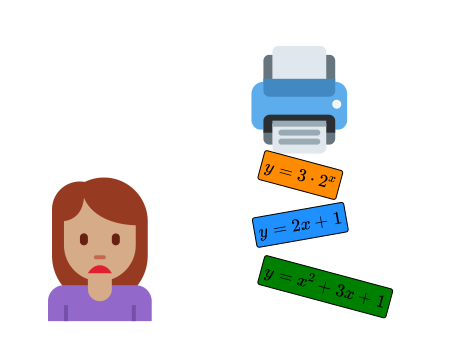
{"type":"pair","form":{"alts":[[{"id":0,"text":"Linear Function"},{"id":1,"text":"Quadratic Function"},{"id":2,"text":"Exponential Function"}],[{"id":0,"text":"y=2x+1"},{"id":1,"text":"y=x^2+3x+1"},{"id":2,"text":"y=3* 2^x"}]],"lockLeft":false,"lockRight":false},"formTextBefore":"","formTextAfter":"","answer":[[0,1,2],[0,1,2]]}
Hint
Review the definitions of linear, quadratic, and exponential functions.
Solution
Consider the first given function. y=3* 2^x Note that the independent variable x is written as an exponent in the function and the base 2 is a non-negative number. Therefore, this is an exponential function. Exponential Function y=3*2^x Now, consider the second function. y=2x+1 This function only contains one linear term and one constant term. This means that it is a linear function. Linear Function y=2x+1 Finally, consider the third function. y=x^2+3x+1 Notice that this is a polynomial function and the highest exponent of the independent variable x is 2. Therefore, it can be concluded that this is a quadratic equation. Quadratic Function y=x^2+3x+1 This information is summarized in the following table.
| Linear Function | y=2x+1 |
|---|---|
| Quadratic Function | y=x^2+3x+1 |
| Exponential Function | y=3* 2^x |
Pop Quiz
Share
Report error
Determining if a Function Is Linear, Quadratic, or Exponential
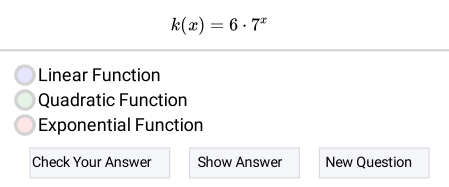
In the following applet, determine whether the given function is linear, quadratic, or exponential.
Discussion
Share
Report error
Finding the Pattern of a Table of Values to Determine Its Model
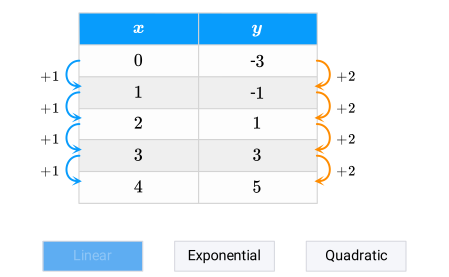
When considering a table of values, the trend of the data can be determined by observing how the dependent variable changes over equal intervals. To do so, the following situations need to be analyzed.
- If the y-values have a common difference, the data follows a linear model.
- If the y-values have a common ratio, the data follows an exponential model.
- If the second differences — the differences of the first differences — are constant, the data follows a quadratic model.
The applet below illustrates each situation.
Example
Share
Report error
Determining the Pattern Describing Real-Life Data Sets
Magdalena's father works as a manager for a fish farming company. This morning, Magdalena and her brother Vincenzo poked around in her father's briefcase. They found some papers containing information about the fish population in three nearby lakes.
| Fish Population (Thousands) | |||
|---|---|---|---|
| Time (Months) | Lake Verdastro | Lake Rumoroso | Lake Mezzo |
| 0 | 1356 | 721 | 1207 |
| 1 | 6676 | 2163 | 3007 |
| 2 | 11 996 | 6489 | 7807 |
| 3 | 17 316 | 19 467 | 15 607 |
| 4 | 22 636 | 58 401 | 26 407 |
{"type":"pair","form":{"alts":[[{"id":0,"text":"Lake Verdastro"},{"id":1,"text":"Lake Rumoroso"},{"id":2,"text":"Lake Mezzo"}],[{"id":0,"text":"Linear"},{"id":1,"text":"Exponential"},{"id":2,"text":"Quadratic"}]],"lockLeft":true,"lockRight":false},"formTextBefore":"","formTextAfter":"","answer":[[0,1,2],[0,1,2]]}
Answer
Lake Verdastro: Linear Function
Lake Rumoroso: Exponential Function
Lake Mezzo: Quadratic Function
Hint
The y-values have a common difference in a linear function, while in an exponential function, the y-values have a common ratio. Furthermore, in a quadratic function, the second differences are constant.
Solution
The recorded data for each lake will be analyzed to determine if they have a common difference, a common ratio, or a constant second difference. So, the data for Lake Verdastro will be analyzed first. 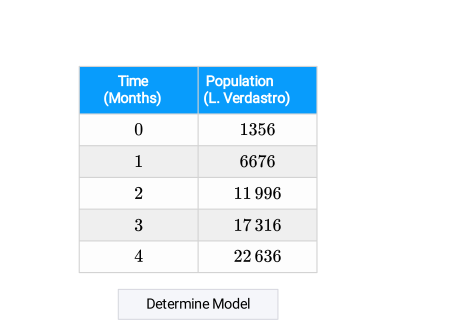 Because the fish population in Lake Verdastro has a common difference of 5320, it can be said that it follows a linear model. The data for Lake Rumoroso will be analyzed in a similar fashion.
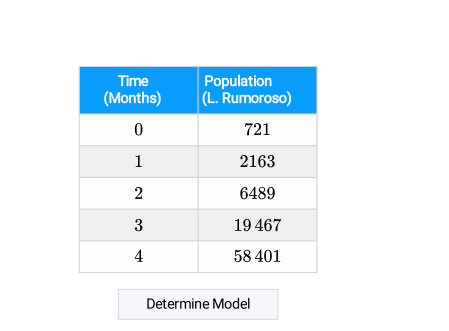 Note that the data of Lake Rumoroso has a common ratio of 3. Therefore, it can be fitted into an exponential function. Finally, the model for the data of Lake Mezzo will be determined.
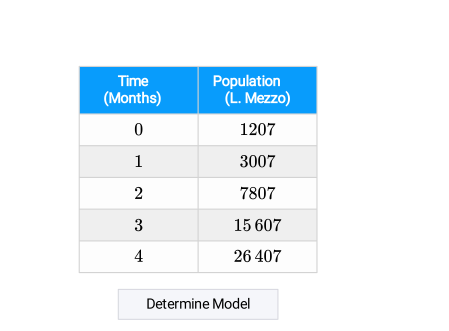 Since the second differences of the data of Lake Mezzo are constant, the fish population for the lake over time can be modeled with a quadratic function. With this, the growth model of the fish population for each lake has been determined.
| Lake | Model |
|---|---|
| Verdastro | Linear Function |
| Rumoroso | Exponential Function |
| Mezzo | Quadratic Function |
Note that the analysis suggests that Lake Rumoroso is the best for fish farming. The children gave this information to their father, who was delighted by this excellent analysis and took them for ice cream as a reward.
Example
Share
Report error
Saving for a New Computer
Magdalena will start college soon, so she decided to start saving money to buy a new computer. The computer she wants costs around $2000. Thanks to her help with the analysis for the fish farming company, her father gave Magdalena an initial amount of $1000. She plans to add $40 to her savings each week.

Magdalena wants to buy the computer as soon as possible. She thinks she will be able to afford it after 30 weeks of saving the money but she isn't sure. Answer the following questions to help her discover if she will save enough money for the new computer by then.
a Can this situation be modeled by a linear, quadratic, or exponential function? Write the function that models the situation.
b How much money will Magdalena have saved after 30 weeks? Interpret the results.
Answer
a Model: Linear Function
Function: B(x)=40x+1000
Function: B(x)=40x+1000
b Answer: $2200
Interpretation: Because the amount of money Magdalena will save after 30 weeks is greater than the computer's price, she will be able to buy the computer.
Interpretation: Because the amount of money Magdalena will save after 30 weeks is greater than the computer's price, she will be able to buy the computer.
Hint
a After x weeks of saving money, the total amount of savings can be determined by adding the product of x and the amount of weekly savings to the initial amount.
b Substitute 30 for x into the function found in Part A. Compare the result with the price of the computer.
Solution
a Magdalena starts with the initial $1000 that her father gave her. Each week she plans to add $40 to this amount. Therefore, her balance B(x) after x weeks can be calculated by adding the product of x and $40 to the initial amount of $1000.
Balance AfterxWeeks B(x)=1000+40x ⇓ B(x)=40x+1000 Looking at the function, it can be concluded that this situation is modeled by a linear function.
c The amount of money that Magdalena will have after 30 weeks can be found by substituting 30 for x in the function found in Part A.
B(x)=40x+1000
Substitute
x= 30
B( 30)=40( 30)+1000
Multiply
Multiply
B(30)=1200+1000
AddTerms
Add terms
B(30)=2200

Example
Share
Report error
Finding the Optimal Increase to Get the Maximum Revenue
Magdalena is happy with her new computer. She is also using it for her part-time job as a designer to help pay for her school expenses. She sells 50 designs per month at $59 each. However, because creating each design is complex, she plans to increase the price of each design. She estimates that for each $5 increase, two fewer designs will be sold per month.

Magdalena wants to know what price will maximize her revenue, or the amount of money she makes. Identify the following information to help Magdalena make the best decision about her small business.
a Identify and write the function that models this situation.
b What is the maximum amount of money that Magdalena could make each month?
c What price would allow Magdalena to sell her designs so that she could make the most money each month?
Answer
a Model: Quadratic Function
Function: R(x)=-10x^2+132x+2950
Function: R(x)=-10x^2+132x+2950
b $3385.60
c $92
Hint
a Begin by writing a function for the new price of a design and another function for the number of designs sold.
b Remember that the axis of symmetry intersects the parabola at its vertex.
c Substitute the x-value of the vertex into the expression of the new price of a design.
Solution
a Magdalena has estimated how each $5 increase will affect the number of designs sold. Let x be the number of $5 price increases. This means the new price N(x) of a design will be the current price of $59 plus x times $5.
R(x)=S(x)* N(x)
SubstituteII
S(x)= 50-2x, N(x)= 59+5x
R(x)=( 50-2x)( 59+5x)
▼
Simplify right-hand side
Distr
Distribute 50-2x
R(x)=(50-2x)59+(50-2x)5x
CommutativePropMult
Commutative Property of Multiplication
R(x)=59(50-2x)+5x(50-2x)
Distr
Distribute 59 & 5x
R(x)=2950-118x+250x-10x^2
AddTerms
Add terms
R(x)=2950+132x-10x^2
CommutativePropAdd
Commutative Property of Addition
R(x)=-10x^2+132x+2950
b Consider the quadratic function R(x) found in Part A.
x=-b/2a
SubstituteII
a= -10, b= 132
x=-132/2( -10)
▼
Evaluate right-hand side
MultPosNeg
a(- b)=- a * b
x=-132/-20
RemoveNegFracAndDenom
- a/- b= a/b
x=132/20
CalcQuot
Calculate quotient
x=6.6
c It was determined that the maximum revenue $3385.60 per month is reached when x= 6.6. This means that Magdalena will need to make 6.6 increases of $5 to the price of a design to make the most amount of money each month. Substitute this value into the function N(x) to find the new price for a design.
Example
Share
Report error
Determining the Storage Needed for a School Assignment
Vincenzo, Magdalena's little brother, loves dinosaurs. He wants to make a 10-minute film for a school assignment, explaining the history of this extinguished group of reptiles. He asked Magdalena to help him make and edit the video on her computer. However, the siblings are worried because Vincenzo has a USB drive with only 16GB to store the film on.

After some research, Magdalena found that any high-quality video file requires an initial storage space of 20MB. This required storage space doubles for each additional minute. The children now have to investigate whether the USB drive has enough space for Vincenzo's completed film. Find the following information to help them.
a Identify the model and write a function representing the size of an x-minute long video.
b Does the USB have enough storage space for Vincenzo's completed video? Explain.
Answer
a Model: Exponential
Function: f(x)=20*2^x
b No, because the video size will be 20GB, which is larger than the USB storage.
Hint
a Consider that exponential functions grow by equal factors over equal intervals.
b Substitute 20 for x in the function found in Part A. Then divide the result by 1024 to convert it from megabytes to gigabytes.
Solution
a It is given that the size of the video grows by a factor of 2 for every minute of the video. This means this situation is represented by an exponential growth and it can be modeled with an exponential function. Consider the general form of an exponential function.
f(x)=a* b^x In this form, b represents the growth factor and a is the y-intercept, which is sometimes referred to as the initial value. Since the video file needs an initial storage space of 20MB and it doubles for every additional minute, substituting 20 for a and 2 for b will give the expression representing the video size after x minutes. f(x)=a* b^x ⇒ f(x)= 20* 2^x
b To determine if the USB storage is large enough for Vincenzo's 10-minute film, evaluate the expression written in Part A for x= 10.
f(x)=20*2^x
Substitute
x= 10
f( 10)=20*2^(10)
CalcPow
Calculate power
f(10)=20*1024
Multiply
Multiply
f(10)=20 480
Closure
Share
Report error
Identifying Some Remarkable Characteristics of Quadratic Functions
Many situations involving linear, quadratic, and exponential functions have been covered throughout this lesson. It is now time to point out some remarkable characteristics of quadratic functions. Consider the applet presented at the beginning of the lesson.
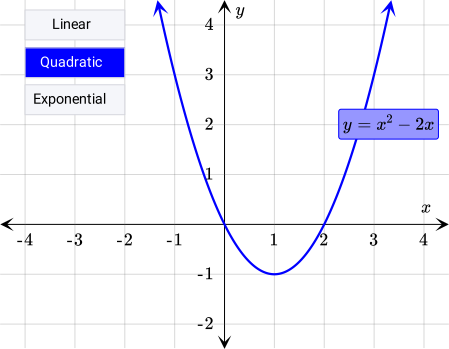 Is it possible to name at least three characteristics of a quadratic function that neither a linear nor an exponential function has?
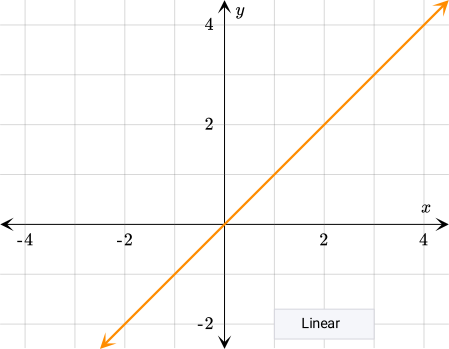 In the applet above, it can be seen that both linear and exponential functions increase throughout the graph. Conversely, the quadratic function is a parabola that shifts from decreasing to increasing at the vertex. Now consider another three functions.
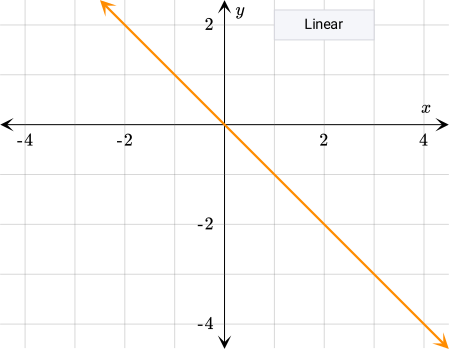 This time both the linear and exponential functions only decrease. The parabola of the quadratic function opens downward now but it still changes directions, this time from increasing to decreasing. With this information, the following conclusion can be made.
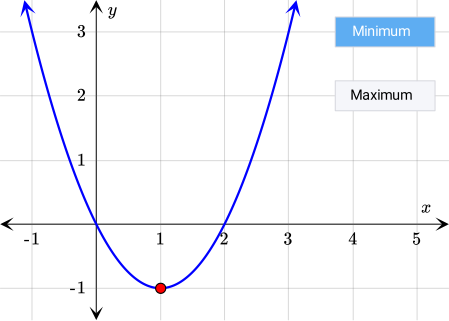 Conversely, linear and exponential functions approach positive infinity or negative infinity since they only decrease or increase, meaning that they do not have an absolute maximum or minimum. The second characteristic for quadratic functions can now be noted.
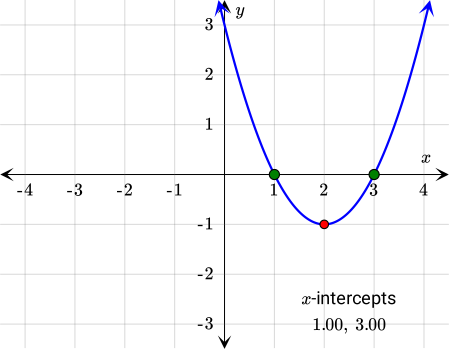 A linear functions whose graph is not horizontal has exactly one x-intercept. Exponential functions can have one or no x-intercepts.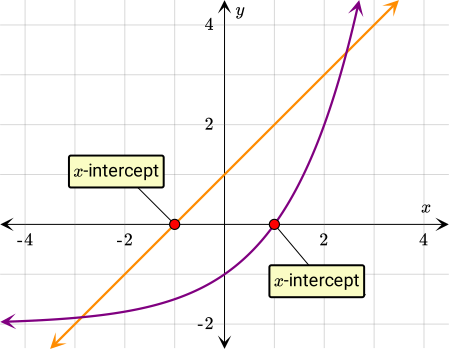
Answer
See solution.
Hint
Begin by analyzing the behavior of the functions. Do all functions have a turning point? What is the maximum number of x-intercepts each function could have?
Solution
Three distinctive characteristics of quadratic functions will be identified one at a time.
First Characteristic
To identify the first characteristic, look at the behavior of the graphs of linear, quadratic, and exponential functions.
Linear and exponential functions either only increase or only decrease. Conversely, quadratic functions always decrease and increase. The order depends on the direction in which the parabola opens.
Second Characteristic
A second unique characteristic can be determined directly from the first. The vertex of a parabola is its turning point. At this point, the function reaches its absolute maximum or minimum. If the parabola opens upward, the vertex represents the absolute minimum. If it opens downward, the vertex is the absolute maximum.
Because a parabola either opens upward or downward, there is always one point that is the absolute minimum or absolute maximum of the function. This point is called the vertex.
Third Characteristic
The x-intercepts of a function are known as the zeros of the function. They are found by setting the function rule equal to zero and simplifying. f(x)=0 Because a quadratic equation has at most 2 solutions, the quadratic function can have one, two, or no x-intercepts.Using this information, a third distinctive characteristic of quadratic functions can be determined.
While non-horizontal linear functions and exponential functions have at most one x-intercept, quadratic functions can have up to two x-intercepts.
Conclusion
Only three distinctive characteristics of quadratic functions are presented here. Please note that there are a few others.
| Three Distinctive Characteristics of Quadratic Functions |
|---|
| Linear and exponential functions either only increase or only decrease. Conversely, quadratic functions always decrease and increase. The order depends on the direction in which the parabola opens. |
| Because a parabola either opens upward or downward, there is always one point that is the absolute minimum or absolute maximum of the function. This point is called the vertex. |
| While non-horizontal linear functions and exponential functions have at most one x-intercept, quadratic functions can have up to two x-intercepts. |
Consider the following graphs.
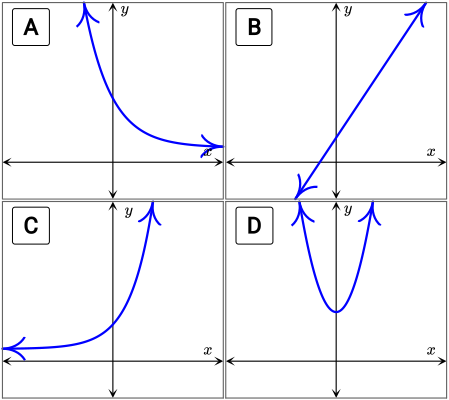
{"type":"pair","form":{"alts":[[{"id":0,"text":"A"},{"id":1,"text":"B"},{"id":2,"text":"C"},{"id":3,"text":"D"}],[{"id":0,"text":"y=0.5^x+2"},{"id":1,"text":"y=2x+1"},{"id":2,"text":"y=2^x+2"},{"id":3,"text":"y=2x^2+2"}]],"lockLeft":true,"lockRight":false},"formTextBefore":"","formTextAfter":"","answer":[[0,1,2,3],[0,1,2,3]]}
security
report
code
security
report
code
By examining the functions, we can see that we have a linear function, two exponential functions, and one quadratic function. We know that this is the case because the linear function has the form y=mx+b, the degree of the x-variable in the quadratic function is 2, and in exponential functions, the variable x appears in an exponent. lcl y = 2x+1 & → & linear [0.4em] y = 2^x+2 & → & exponential [0.4em] y = 0.5^x+2 & → & exponential [0.4em] y = 2x^2+2 & → & quadratic Let's now start matching the functions with the graphs.
Linear Function
A linear function is graphically represented by a straight line. We can only see one graph that is a straight line and that is graph B. Therefore, we should match the linear function with B. B → y=2x+1
Quadratic Function
The graph of a quadratic equation has the form of a parabola, a curve that is symmetric along the vertical line that passes through its vertex. There is only one graph that exhibits these characteristics, graph D. D → y=2x^2+2
Exponential Functions
Of the two remaining graphs, both exponential functions, we can see that one represents an increasing function and the other represents a decreasing function.
An increasing exponential function has a base, or constant multiplier, greater than 1. Conversely, a decreasing exponential function has a base that is less than 1 but greater than 0.
Increasing:& y = ab^x b>1
Decreasing:& y = ab^x 0
security
report
code
The graphs of two functions are shown on the first quadrant of a coordinate plane.
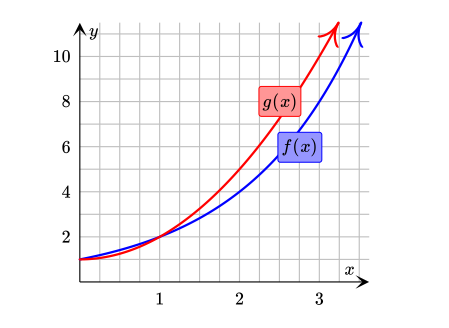
{"type":"choice","form":{"alts":["A. f(x) is an exponential function and g(x) is a quadratic function.","B. f(x) is a quadratic function and g(x) is an exponential function.","C. Both f(x) and g(x) are quadratic functions.","D. Both f(x) and g(x) are exponential functions."],"noSort":true},"formTextBefore":"","formTextAfter":"","answer":0}
security
report
code
security
report
code
We will analyze f(x) and g(x) one at a time.
f(x)
Let's identify three points on the graph of f(x).
Since we know that the graph is not a line, the first differences are not constant. Let's calculate the second differences.
The second differences are not constant. Therefore, f(x) is not a quadratic function. Let's see if it is an exponential function by checking whether the y-coordinates of these points have a common ratio.
The y-values of consecutive data points have a common ratio. This means that f(x) is an exponential function.
g(x)
Let's start by identifying some points on the graph of g(x).
We already know that g(x) is not a linear function. Just as we did for f(x), we will analyze the second differences between consecutive data points.
Here, the second differences are constant. Therefore, we do not need to analyze if there is a common ratio because we already know that g(x) is a quadratic function. The correct choice is A.
security
report
code
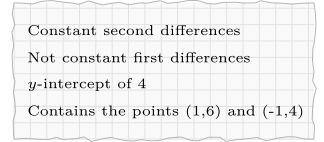
Diego wants to write a function that satisfies the following conditions.
{"type":"text","form":{"type":"math","options":{"comparison":"1","nofractofloat":false,"keypad":{"simple":false,"useShortLog":false,"variables":["x"],"constants":[]},"rendered":false},"text":" "},"formTextBefore":"y =","formTextAfter":null,"answer":{"text":["x^2+x+4","(x+\\dfrac{1}{2})^2+\\dfrac{15}{4}","1x^2+1x+4","1(x+\\dfrac{1}{2})^2+\\dfrac{15}{4}"]}}
security
report
code
security
report
code
The function that Diego wants to write has constant second differences but not constant first differences. Therefore, we know that this is a quadratic function.
Let's recall the standard form of a quadratic function. y = ax^2+bx+c We know that the y-intercept is 4. This means that the value of c is 4. y = ax^2+bx+4 Next, because we know that the parabola passes through ( 1, 6) and ( - 1, 4), we can form a system of equations with a and b as its variables. 6 = a( 1)^2+b( 1)+4 & (I) 4 = a( - 1)^2+b( - 1)+4 & (II) Let's solve the system by using the Elimination Method. To do so, we will first simplify the equations.
Now, we can add Equation (I) to Equation (II).
Finally, we will substitute 1 for a in Equation (I).
Now that we know that both a and b are equal to 1, we can write the quadratic function. y=1x^2+1x+4 ⇕ y=x^2+x+4
security
report
code
Comparing Linear, Exponential, and Quadratic Functions
Recommended exercises
To get personalized recommended exercises, please login first.
Loading content
Loading content