5. Transformations of Absolute Value Functions
Sign In
An error ocurred, try again later!
Chapter 3
5.
Transformations of Absolute Value Functions
Delve into transformations of absolute value functions and how these functions can be shifted, stretched, shrunk, or reflected to create new functions. The parent function of an absolute value function is showcased as f(x)=|x|, serving as a foundation for understanding the various transformations. The lesson explains how the graph of an absolute value function can be translated both vertically and horizontally. Additionally, the concept of stretching and shrinking is introduced, emphasizing how the graph's width or height can be altered without shifting its position. Reflections are another transformation type, where the function's graph is flipped without changing its shape. The lesson provides practical examples, such as Emily's water tank scenario, to illustrate how these transformations can be visualized in real-world situations. Overall, the lesson offers a blend of theoretical knowledge and practical applications, making it easier for learners to grasp the intricacies of absolute value function transformations.
Show less Show more expand_more 


Lesson Settings & Tools
| | 14 Theory slides |
| | 9 Exercises - Grade E - A |
| | Each lesson is meant to take 1-2 classroom sessions |
Transformations of Absolute Value Functions
Slide of 14
The functions belonging to the same function family can be transformed into each other by translations, stretching and shrinking, or reflections. By applying one or several transformations to a parent function, it is possible to obtain any function from its function family. This lesson will focus on the transformations of absolute value functions.
Catch-Up and Review
Here are a few recommended readings before getting started with this lesson.
Explore
Share
Report error
Investigating the Translations of Absolute Value Functions
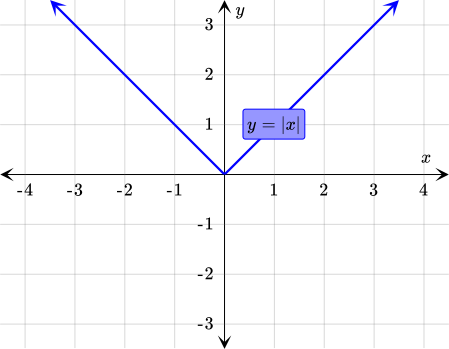
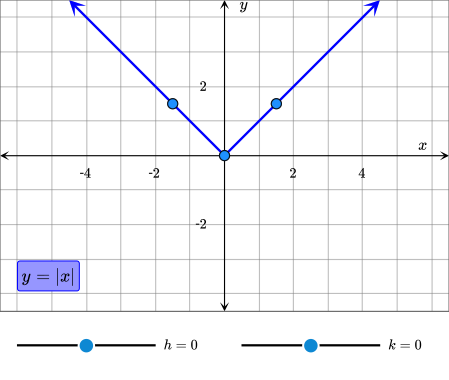
Consider the graph of the parent absolute value function.
Discussion
Share
Report error
Translations of Absolute Value Functions
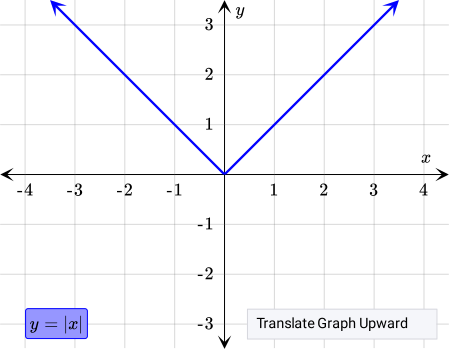
The graph of an absolute value function y=|x| can be translated vertically by adding a number to — or subtracting from — the function rule.
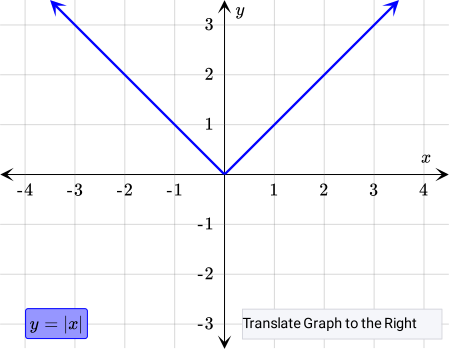
 Likewise, it can be also translated horizontally by adding a number to — or subtracting from — the rule's input.
 The table below summarizes the different types of translations that can be performed for shifting an absolute value function.
| Transformations of y=|x| | |
|---|---|
| Vertical Translations | Translation up k units, k>0 y=|x|+ k |
| Translation down k units, k<0 y=|x|+ k | |
| Horizontal Translations | Translation to the right h units, h>0 y=|x- h| |
| Translation to the left h units, h<0 y=|x- h| | |
Example
Share
Report error
Matching Graphs with Their Functions
Tadeo just learned about translations of absolute value functions. He believes in the motto that practice makes perfect, so he decides to study more. The following graphs are the graphs of the absolute value parent function after a certain translation.
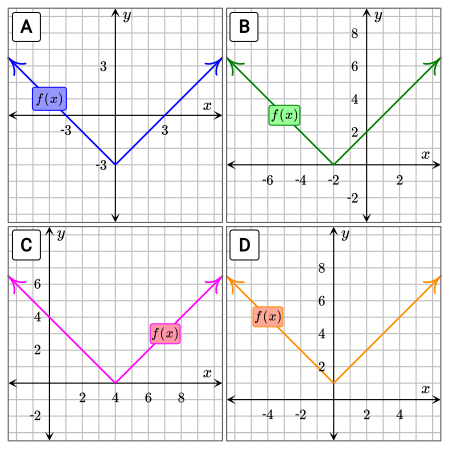
{"type":"pair","form":{"alts":[[{"id":0,"text":"Graph A"},{"id":1,"text":"Graph B"},{"id":2,"text":"Graph C"},{"id":3,"text":"Graph D"}],[{"id":0,"text":"f(x)=|x|-3"},{"id":1,"text":"f(x)=|x+2|"},{"id":2,"text":"f(x)=|x-4|"},{"id":3,"text":"f(x)=|x|+1"}]],"lockLeft":false,"lockRight":false},"formTextBefore":"","formTextAfter":"","answer":[[0,1,2,3],[0,1,2,3]]}
Hint
Compare the given graphs to the graph of the absolute value parent function to identify the translation applied to each graph.
Solution
Begin by identifying the translation of each graph when compared to the graph of the absolute value parent function f(x)=|x|.
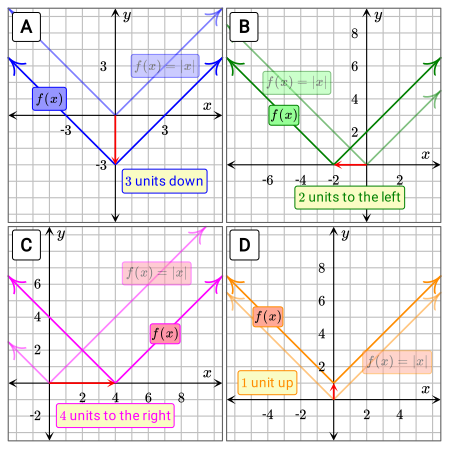
Now that the translations have been identified, recall the translation rules.
| Transformations of y=f(x) | |
|---|---|
| Horizontal Translations | Translation to the right by h units, h>0 y=f(x-h) |
| Translation to the left by h units, h<0 y=f(x-h) | |
| Vertical Translations | Translation upwards by k units, k>0 y=f(x)+k |
| Translation downwards by k units, k<0 y=f(x)+k | |
Using this table, the function rules of the graphs can be written. Graph A:& f(x)=|x|- 3 Graph B:& f(x)=|x+ 2| Graph C:& f(x)=|x- 4| Graph D:& f(x)=|x|+ 1
Example
Share
Report error
Identifying and Correcting Error
Tadeo and Emily are classmates in North High School. They have been asked to translate the following absolute value function 5 units to the right and then 3 units down. f(x)=2|x+2|-1
Yet, they obtained different results. 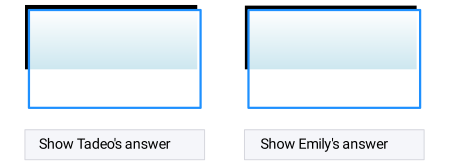 By performing the required translations, determine who is correct!
{"type":"choice","form":{"alts":["Tadeo","Emily","Both","Neither"],"noSort":false},"formTextBefore":"","formTextAfter":"","answer":1}
Hint
The graph of an absolute value function y=|x| can be translated vertically by adding a number to — or subtracting from — the function rule. Likewise, it can be also translated horizontally by adding a number to — or subtracting from — the rule's input.
Solution
An absolute value function can be translated 5 units to the right by subtracting 5 from the function rule's input. To do so, substitute x-5 for x into f(x)=2|x+2|-1.
Next, to translate the resulting function 3 units down, 3 must be subtracted from the function rule.
Finally, the result can be simplified by replacing f(x-5)-3 with g(x).
g(x)=2|x-3|-4
As a result, Emily is correct.
Pop Quiz
Share
Report error
Identifying the Translations of an Absolute Value Graph
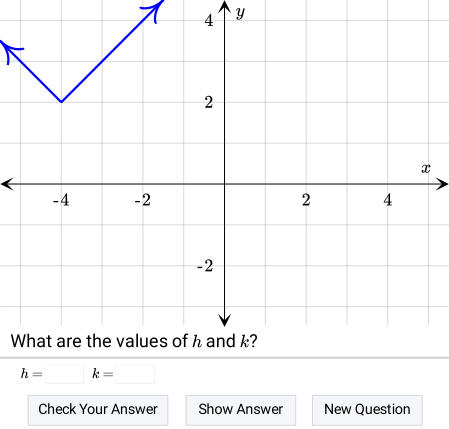
The following applet shows the graph of an absolute value function in the form of f(x)=|x-h|+k, where h and k are integers. Considering the translation rules, determine the values of h and k.
Explore
Share
Report error
Investigating the Transformations of an Absolute Value Function
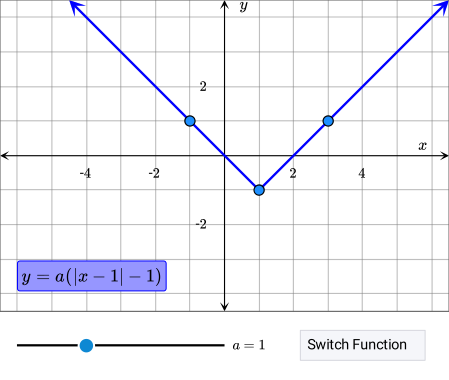
Apart from translations, new absolute value functions can be constructed by shrinking or stretching an absolute value function. Consider the following functions. Function I & Function II y=a(|x-1|-1) & y=|bx-1|-1 In these examples, a and b are real numbers greater than 0. Investigate how the values of a and b change the graph of y=|x-1|-1.
Discussion
Share
Report error
Stretch and Shrink of a Function
Concept
Share
Report error
Vertical Stretch and Shrink of a Function
The graph of a function can be vertically stretched or shrunk by multiplying the function rule by a positive number a.
y = a * f(x)
The vertical distance between the graph and the x-axis will then change by the factor a at every point on the graph. If a > 1, this will lead to the graph being stretched vertically. Similarly, a < 1 leads to the graph being shrunk vertically. Note that x-intercepts have the function value 0. Therefore, they are not affected by this transformation.
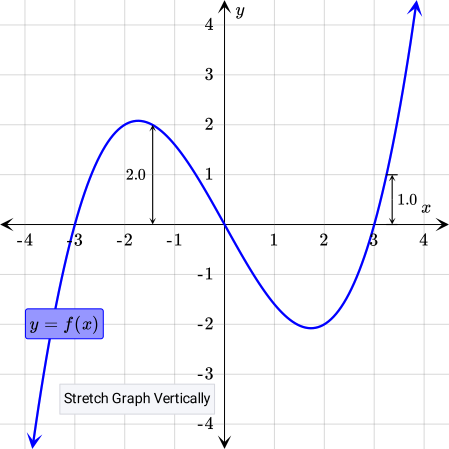 The general form of this transformation is shown in the table.
| Transformations of f(x) | |
|---|---|
| Vertical Stretch or Shrink | Vertical stretch, a>1 y= af(x) |
| Vertical shrink, 0< a< 1 y= af(x) | |
Concept
Share
Report error
Horizontal Stretch and Shrink of a Function
By multiplying the input of a function by a positive number b, its graph can be horizontally stretched or shrunk.
y = f(b * x)
If b > 1, every input value will be changed as though it was farther away from the y-axis than it really is. This leads to the graph being shrunk horizontally — every part of the graph is moved closer to the y-axis. Conversely, b < 1 leads to a horizontal stretch. The horizontal distance between the graph and the y-axis is changed by a factor of 1b.
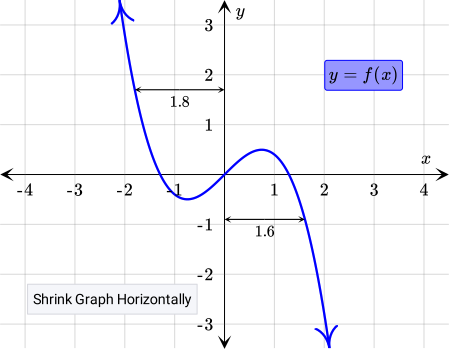 Note that y-intercepts have the x-value 0, which is why they are not affected by this transformation. The general form of this transformation is shown in the table.
| Transformations of f(x) | |
|---|---|
| Horizontal Stretch or Shrink | Horizontal stretch, 0< b<1 y=f( bx) |
| Horizontal shrink, b>1 y=f( bx) | |
Discussion
Share
Report error
Stretch and Shrink of an Absolute Value Function
A stretch and shrink of an absolute value function is a transformation that changes the width of the graph of the function without shifting it. The graph of an absolute value function y=|x-1|-1 can be stretched or shrunk vertically by multiplying the function rule by a positive number.
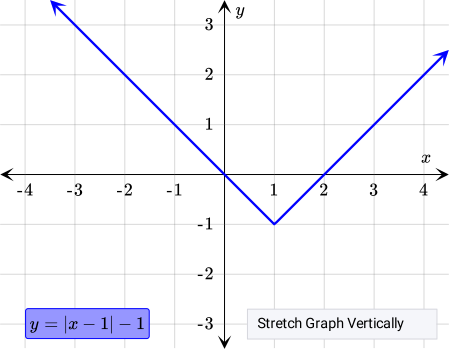 Likewise, the graph of an absolute value function y=|x-0.5| can be also stretched or shrunk horizontally by multiplying the rule's input by a positive number.
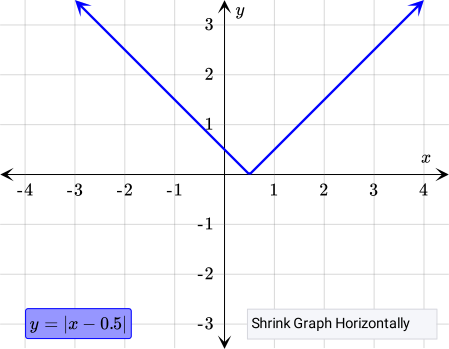 The table below summarizes the different types of stretch and shrink that can be performed for an absolute value function.
| Transformations of y=|x| | |
|---|---|
| Vertical Stretch or Shrink | Vertical stretch, a>1 y= a|x| |
| Vertical shrink, 0< a< 1 y= a|x| | |
| Horizontal Stretch or Shrink | Horizontal stretch, 0< b<1 y=| bx| |
| Horizontal shrink, b>1 y=| bx| | |
Example
Share
Report error
Draining and Refilling Water Tank
Emily uses a water tank that contains 10 cubic meters of water to water her plants. She drains the water tank from one faucet and then refills it from another identical faucet.
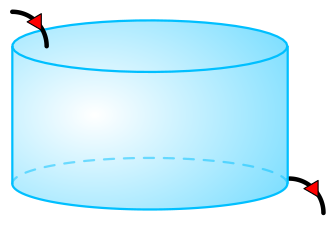
The following graph models the water level of the tank when it is drained and then refilled after t minutes.
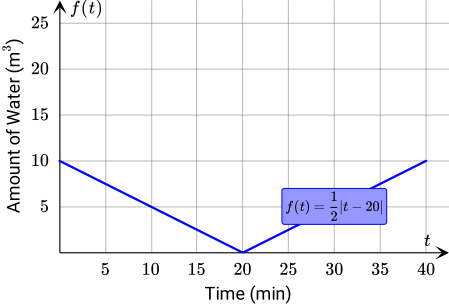
a Emily notices that when she doubles both the amount of the water and the diameter of the faucets, the graph of the function vertically stretches by a factor of 2. If that is the case, what is the function of the transformed graph.
{"type":"text","form":{"type":"math","options":{"comparison":"1","nofractofloat":false,"keypad":{"simple":false,"useShortLog":false,"variables":["t"],"constants":["PI"]},"rendered":false},"text":" "},"formTextBefore":"f(t)=","formTextAfter":null,"answer":{"text":["|t-20|"]}}
b If Emily only doubles the diameter of the faucets, the graph of the function shrinks horizontally. In this case, what would be the function of the new graph?
{"type":"text","form":{"type":"math","options":{"comparison":"1","nofractofloat":false,"keypad":{"simple":false,"useShortLog":false,"variables":["t"],"constants":["PI"]},"rendered":false},"text":" "},"formTextBefore":"f(t)=","formTextAfter":null,"answer":{"text":["\\dfrac{1}{2}|2t-20|"]}}
Hint
a The graph of an absolute value function y=f(x) can be stretched or shrunk vertically by multiplying the function rule by a positive number.
b The graph of an absolute value function y=f(x) can be stretched or shrunk horizontally by multiplying the rule's input by a positive number.
Solution
a Recall that, when Emily doubles both the amount of the water and the diameter of the faucets, the graph of the function vertically stretches by a factor of 2.
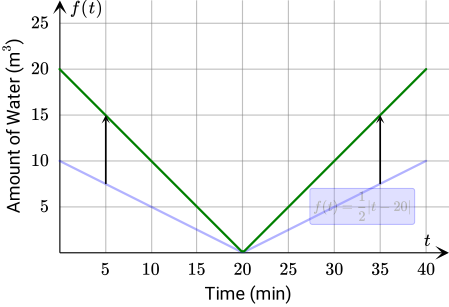
To stretch the graph of an absolute value function vertically, the function rule should be multiplied by a positive number. In this case, it should be multiplied by 2. With this information, the function of the transformed graph can be written. f(t)=1/2|t-20| ⇓ f(t)=|t-20|
b This time Emily doubles only the diameter of the faucets. As a result the the graph of the function shrinks horizontally by factor of 2.
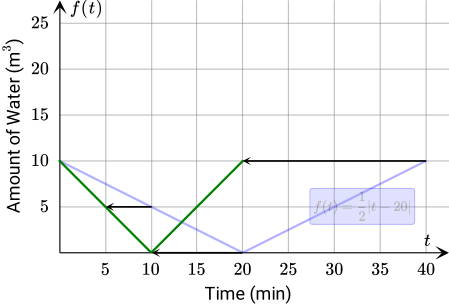
To shrink the graph of an absolute value function horizontally, the function rule's input should be multiplied by a positive number. In this case, it should be multiplied by 2. f(t)=1/2|t-20| ⇓ f(t)=1/2|2t-20|
Discussion
Share
Report error
Reflection of a Function
A reflection of a function is a transformation that flips a graph over some line. This line is called the line of reflection and is commonly either the x- or y-axis. A reflection in the x-axis is achieved by changing the sign of the y-coordinate of every point on the graph.
y = - f(x)
The y-coordinate of all x-intercepts is 0. Thus, changing the sign of the function value at x-intercepts makes no difference — any x-intercepts are preserved when a graph is reflected in the x-axis.
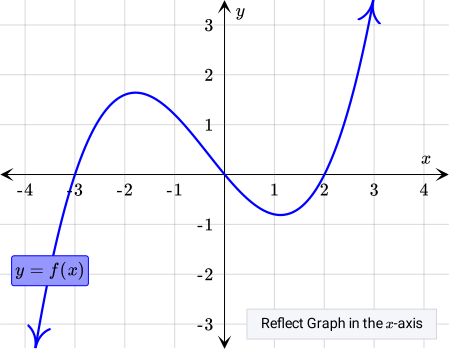 A reflection in the y-axis is instead achieved by changing the sign of every input value.
y = f(- x)
When x = 0, which is at the y-intercept, this reflection does not affect the input value. Therefore, the y-intercept is preserved by reflections in the y-axis.
A reflection in the y-axis is instead achieved by changing the sign of every input value.
y = f(- x)
When x = 0, which is at the y-intercept, this reflection does not affect the input value. Therefore, the y-intercept is preserved by reflections in the y-axis.
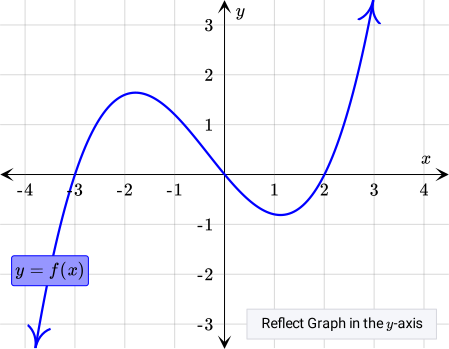 The following table illustrates the different types of reflections that can be done to a function.
| Transformations of f(x) | |
|---|---|
| Reflections | In the x-axis y=- f(x) |
| In the y-axis y=f(- x) | |
Discussion
Share
Report error
Reflection of an Absolute Value Function
One last transformation that can be applied to absolute value functions are reflections. A reflection of an absolute value function is a transformation that flips the graph without changing its shape. The graph of an absolute value function y=|x-1|-1 can be reflected in the x-axis by multiplying the function rule by -1. 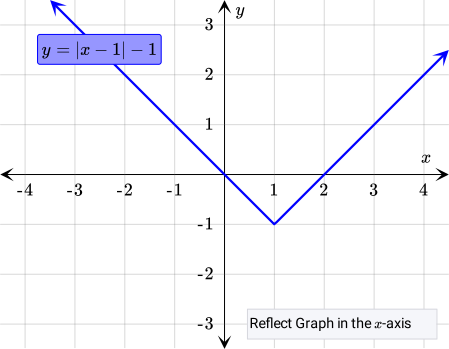 In a similar way, the graph of an absolute value function y=|2x-2|-1 can be also reflected in the y-axis by multiplying the rule's input by -1.
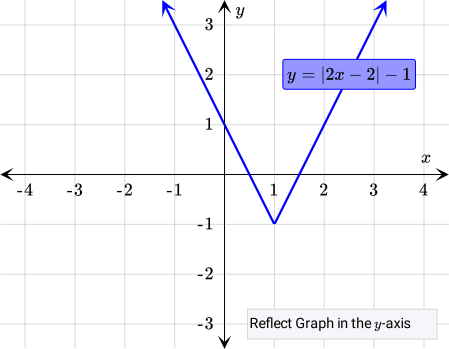 The table below summarizes the different types of reflections that can be performed for an absolute value function.
| Transformations of y=|x| | |
|---|---|
| Reflections | In the x-axis y=- |x| |
| In the y-axis y=|- x| | |
Example
Share
Report error
Construction via Reflection
a As a result of reflecting an absolute value function, some symmetric figures can be obtained. Currently, Emily is working on the following absolute value function.
W.Write the equation of the reflected function by determining the type of the reflection.
{"type":"choice","form":{"alts":["Reflection in the x-axis, g(x)=-|2x-5|","Reflection in the y-axis, g(x)=-|2x-5|","Reflection in the x-axis, g(x)=|-2x-5|","Reflection in the y-axis, g(x)=|-2x-5|"],"noSort":false},"formTextBefore":"","formTextAfter":"","answer":3}
b By reflecting an absolute value function, a quadrilateral can also be obtained. Consider the following absolute value function.
{"type":"choice","form":{"alts":["Reflection in the x-axis, g(x)=-1\/2|x-4|+2","Reflection in the y-axis, g(x)=-1\/2|x-4|+2","Reflection in the x-axis, g(x)=1\/2|-x-4|-2","Reflection in the y-axis, g(x)=1\/2|-x-4|-2"],"noSort":false},"formTextBefore":"","formTextAfter":"","answer":0}
Hint
a Begin by graphing the given function. Note that the graph of an absolute value function y=f(x) can be reflected in the x-axis by multiplying the function rule by -1. In a similar way, the function can be also reflected in the y-axis by multiplying the rule's input by -1.
b Begin by graphing the given function. Note that the graph of an absolute value function y=f(x) can be reflected in the x-axis by multiplying the function rule by -1. In a similar way, it can be also reflected in the y-axis by multiplying the rule's input by -1.
Solution
a To see how to obtain the letter
W,begin by graphing the given function by using a table of values.
| x | f(x)=|2x-5| | f(x) |
|---|---|---|
| -1 | f(x)=|2( -1)-5| | 7 |
| 0 | f(x)=|2( 0)-5| | 5 |
| 1 | f(x)=|2( 1)-5| | 3 |
| 2.5 | f(x)=|2( 2.5)-5| | 0 |
| 4 | f(x)=|2( 4)-5| | 3 |
| 5 | f(x)=|2( 5)-5| | 5 |
| 6 | f(x)=|2( 6)-5| | 7 |
Now plot the ordered pairs and connect them to graph the absolute value function.
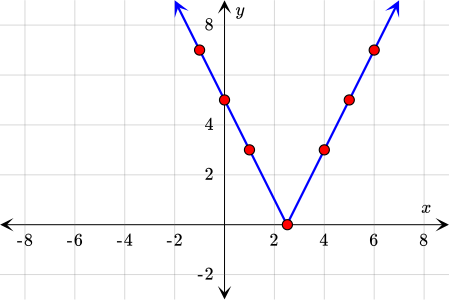
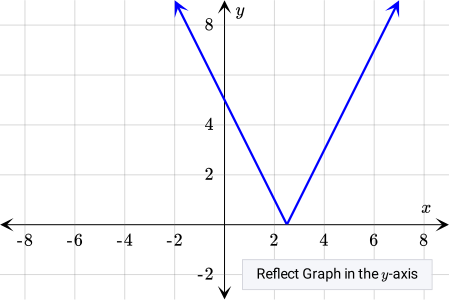
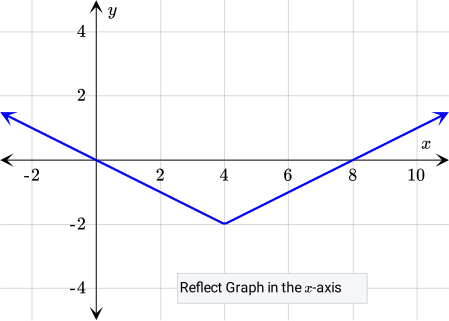
b In a similar way, draw the graph of f(x) to identify the type of the reflection.
| x | f(x)=1/2|x-4|-2 | f(x) |
|---|---|---|
| -2 | f(x)=1/2| -2-4|-2 | 1 |
| 0 | f(x)=1/2| 0-4|-2 | 0 |
| 2 | f(x)=1/2| 2-4|-2 | -1 |
| 4 | f(x)=1/2| 4-4|-2 | -2 |
| 6 | f(x)=1/2| 6-4|-2 | -1 |
| 8 | f(x)=1/2| 8-4|-2 | 0 |
| 10 | f(x)=1/2| 10-4|-2 | 1 |
Plot the ordered pairs and draw the graph.
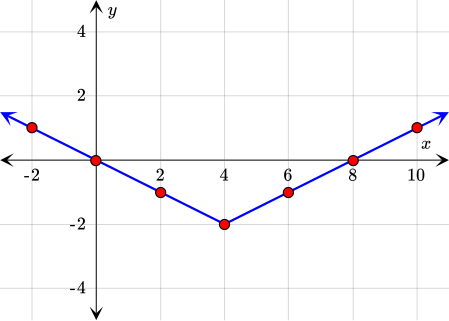
Closure
Share
Report error
Constructing an Absolute Value Function from a Linear Function
Throughout the lesson, the transformations of absolute value functions have been covered. It has been seen that different absolute value functions can be obtained by transforming the absolute value parent function or another absolute value function. However, this is not the only way to obtain an absolute value function. Consider a linear function in slope-intercept form.
f(x)=1/2x-1
Draw the graph of this function and reflect the negative part of the graph in the x-axis.
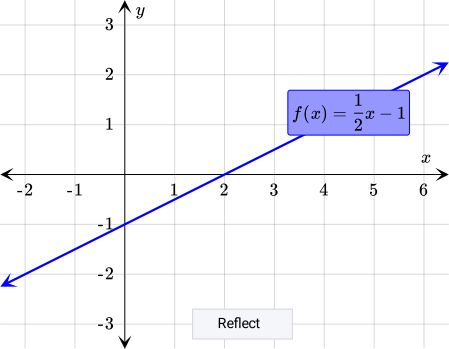 The resulting function is an absolute value function of the form g(x)=|mx+b|, where m and b are real numbers and m cannot be 0.
g(x)=|1/2x-1| Therefore, absolute value functions in the form g(x)=|mx+b| can be obtained by reflecting the negative part of the graph of a linear function in the form f(x)=mx+b.
The resulting function is an absolute value function of the form g(x)=|mx+b|, where m and b are real numbers and m cannot be 0.
g(x)=|1/2x-1| Therefore, absolute value functions in the form g(x)=|mx+b| can be obtained by reflecting the negative part of the graph of a linear function in the form f(x)=mx+b.
Transformations of Absolute Value Functions
Exercises
The parent function of an absolute value function is f(x)=|x| and its graph is as follows.
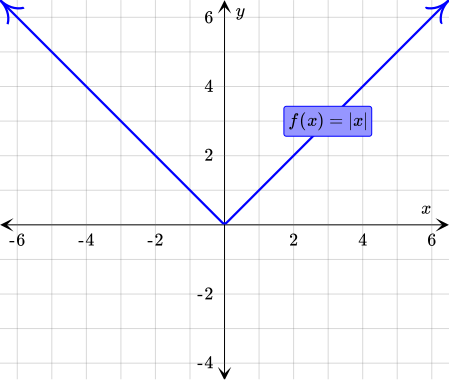
Determine the graph of each of the following functions by translating the absolute value parent function.
Let g(x)=|x+2|.
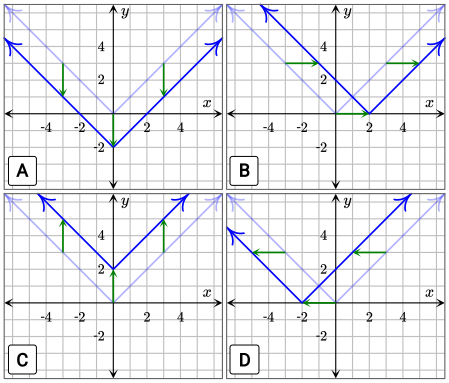
{"type":"choice","form":{"alts":["A","B","C","D"],"noSort":true},"formTextBefore":"","formTextAfter":"","answer":3}
Let h(x)=|x|-2.
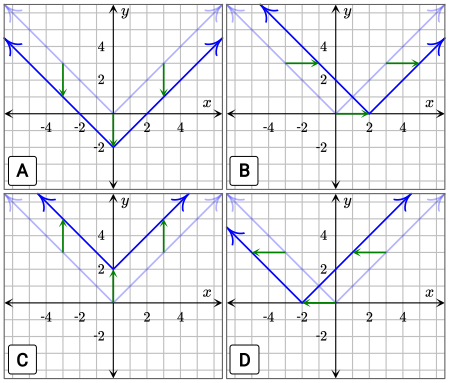
{"type":"choice","form":{"alts":["A","B","C","D"],"noSort":true},"formTextBefore":"","formTextAfter":"","answer":0}
security
report
code
security
report
code
Let's recall the given function. g(x)=|x+ 2| We can see that a number is added to the input of f(x) to get g(x). This means that g(x) is the horizontal translation of f(x) to the left 2 units.
Therefore, the graph of g(x) is given in option D.
When we look at the function h(x), we can see that a number is subtracted from the output of f(x).
h(x)=|x|- 2
With this operation, we are translating the graph of f(x) down 2 units.
From here, we can conclude that the graph of h(x) is given in option A.
The table below summarizes the different types of translations that can be performed for shifting an absolute value function.
| Transformations of y=|x| | |
|---|---|
| Vertical Translations | Translation up k units, k>0 y=|x|+ k |
| Translation down k units, k<0 y=|x|+ k | |
| Horizontal Translations | Translation to the right h units, h>0 y=|x- h| |
| Translation to the left h units, h<0 y=|x- h| | |
We can use this table to identify the translations applied to the absolute value functions.
security
report
code
{"type":"text","form":{"type":"math","options":{"comparison":"1","nofractofloat":false,"keypad":{"simple":false,"useShortLog":false,"variables":["x"],"constants":["PI"]},"rendered":false},"text":" "},"formTextBefore":"g(x)=","formTextAfter":null,"answer":{"text":["|3x|"]}}
The graph of the absolute value parent function f(x)=|x| is given along with the graph of h(x)=a|x|, where a is a real number other than 0.
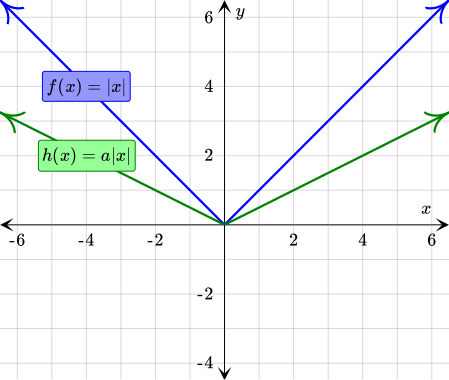
{"type":"text","form":{"type":"math","options":{"comparison":"1","nofractofloat":false,"keypad":{"simple":true,"useShortLog":false,"variables":[],"constants":[]},"rendered":false},"text":" "},"formTextBefore":"a=","formTextAfter":null,"answer":{"text":["0.5"]}}
security
report
code
security
report
code
Let's begin by recalling the general form of a horizontal stretch or shrink of an absolute value function.
| Transformations of y=|x| | |
|---|---|
| Horizontal Stretch or Shrink | Horizontal stretch, 0< b<1 y=| bx| |
| Horizontal shrink, b>1 y=| bx| | |
Since we want a horizontal shrink by a factor of 3,
we can write the required function by substituting 3 for b in the given form.
g(x)=| bx| ⇒ g(x)=| 3x|
Note that we can get the graph of h(x) by multiplying the output of f(x) by a. Therefore, the graph of h(x) is the graph of f(x) vertically stretched or shrunk. Let's choose a point on each graph and compare them vertically.
We can see that the y-coordinate of the point on h(x) is half the y-coordinate of the point on f(x). This means that we can get the y-coordinate of the point on h(x) by multiplying the y-coordinate of the point on f(x) by 12. Let's recall the general form of a vertical stretch or shrink of an absolute value function.
| Transformations of y=|x| | |
|---|---|
| Vertical Stretch or Shrink | Vertical stretch, a>1 y= a|x| |
| Vertical shrink, 0< a< 1 y= a|x| | |
This table tells us that the graph of h(x) is the graph of f(x) vertically shrunk by a factor of 12. Therefore, the value of a is 12.
security
report
code
Write a function g(x) whose graph is the reflection of the graph of f(x)=3|x-2| in the y-axis.
{"type":"text","form":{"type":"math","options":{"comparison":"1","nofractofloat":false,"keypad":{"simple":false,"useShortLog":false,"variables":["x"],"constants":[]},"rendered":false},"text":" "},"formTextBefore":"g(x)=","formTextAfter":null,"answer":{"text":["3|-x-2|","3|x+2|"]}}
security
report
code
security
report
code
Let's begin by recalling the general form of a reflection of an absolute value function.
| Transformations of y=|x| | |
|---|---|
| Reflections | In the x-axis y=- |x| |
| In the y-axis y=|- x| | |
This table tells us that if we want to reflect an absolute value function in the y-axis, we should multiply its input by -1. ccc Original Function & & Reflection iny-axis [0.5em] f(x)=3|x-2| & & g(x)=3|- x-2| We can simplify the function g(x) by using the properties of absolute value.
The function whose graph is the reflection of the graph of f(x)=3|x-2| in the y-axis is g(x)=3|x+2|.
security
report
code
Consider the graph of the absolute parent function f(x)=|x|.
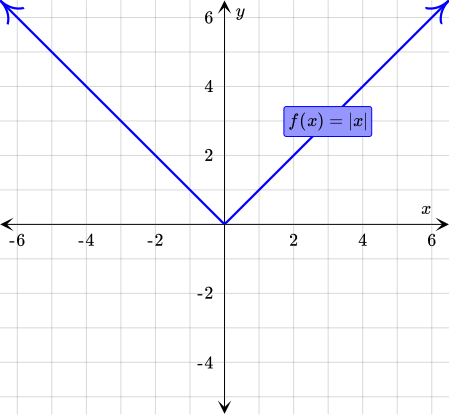
Let the graph of h(x) be the graph of f(x) translated 3 units to the right, vertically stretched by a factor of 2, and reflected on the x-axis.
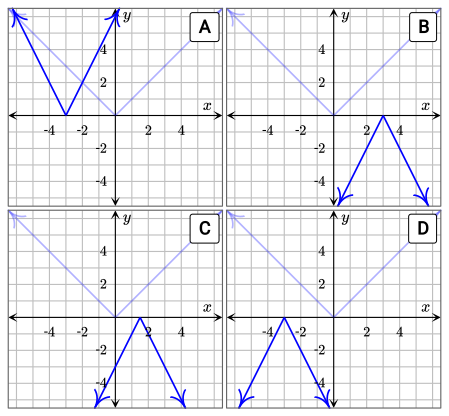
{"type":"choice","form":{"alts":["A","B","C","D"],"noSort":true},"formTextBefore":"","formTextAfter":"","answer":1}
security
report
code
security
report
code
To determine the graph of h(x), we will apply the transformations to the graph of f(x) one at a time. Let's begin by translating the graph of f(x) to the right 3 units. To do so, we add 3 to the x-coordinate of the points on the graph of f(x).
Next, we will stretch the resulting graph vertically by a factor of 2 by multiplying the y-coordinate of the points on the graph by 2.
Finally, we reflect the graph in the x-axis by multiplying the y-coordinate of the points on the graph by -1.
Now that we have the graph of h(x), we can see that it matches the graph in option B.
security
report
code
Transformations of Absolute Value Functions
Recommended exercises
To get personalized recommended exercises, please login first.
Loading content
≤
>
■2
■▢
e▢
7
8
9
×
÷■1
=
=
√▢
▢√
∫▢▢
4
5
6
+
−
≤
<
log
ln
log▢
1
2
3
()
∣
sin
cos
tan
0
.
π
x
y
Loading content