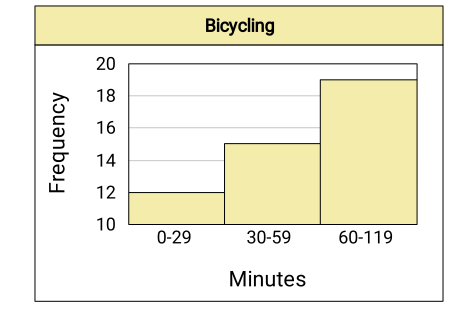
Consider the given histogram. We will describe how the graph is misleading and how someone might misinterpret it.
Note that the third interval is not of the same size as the others, and the scale on the vertical axis starts at 10 and does not have a break. Therefore, someone might believe that the frequency for each 30-minute interval is increasing. Here, we are only showing one of the many possible interpretations.