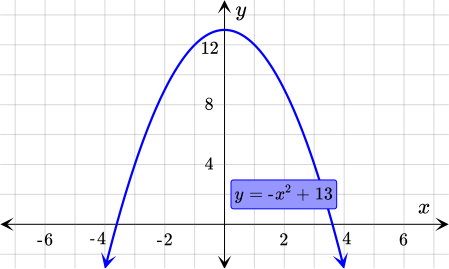
Recall that the standard form of a quadratic function has the form y= ax^2+ bx+ c. Let's identify the values of a, b, and c.
y=- x^2+13 ⇔ y= - 1x^2+ 0x+ 13
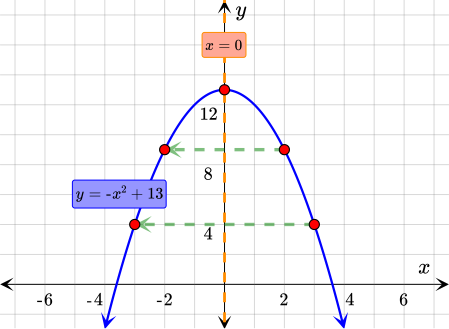
We can calculate the axis of symmetry by substituting a= - 1 and b= 0 into the formula for the vertex of a parabola.
We have calculated that the axis of symmetry is the vertical line x= . Now, let's plot the obtained points and their reflections across the axis of symmetry. Then we can connect them with a parabola.