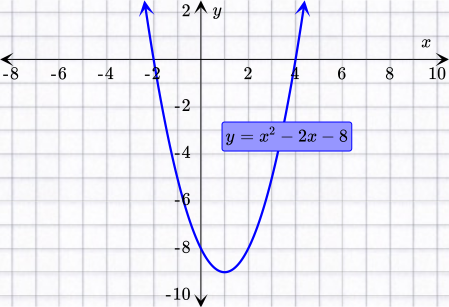
Start by making a table of values. Then, plot the points from the table and connect them with a smooth curve.
B
b
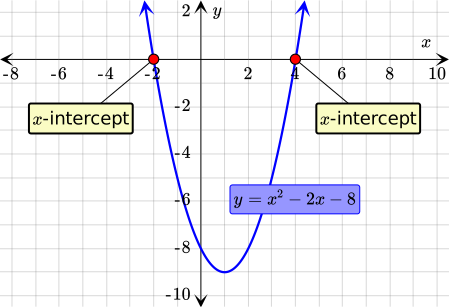
The x-intercepts are the points where a graph crosses the x-axis.
C
c
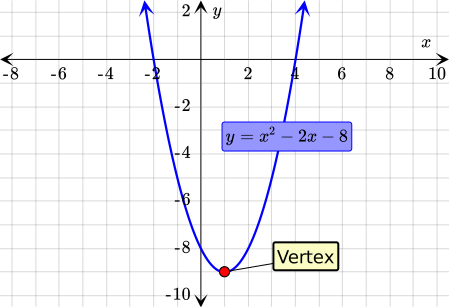
To identify the vertex, find the lowest point of the graph.
A
a
Graph:
y-intercept: (0,- 8) Connection: See solution.
B
b
(- 2,0) and (4,0)
C
c
(1,- 9)
Practice makes perfect
a
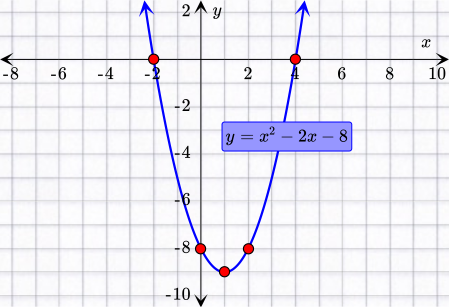
We want to graph the given quadratic function. To do this we will make a table of values using five points. Remember to use not only positive values of x, but also negative ones.
Graphing
x
x^2-2x-8
y=x^2-2x-8
- 2
( - 2)^2-2( - 2)-8
0
0
0^2-2( 0)-8
- 8
1
1^2-2( 1)-8
- 9
2
2^2-2( 2)-8
- 8
4
4^2-2( 4)-8
0
Now, we can graph the function on a graph paper by plotting the points from the table. Because the graph of a quadratic function is a parabola, we will connect them with a smooth curve.
y-intercept
Consider the standard form of a quadratic function, y=ax^2+bx+c, where a ≠ 0. In this form, c is the y-intercept. Let's identify the value of c in the given rule.
y=x^2-2x-8
⇕
y=1x^2+(- 2)x+(- 8)
We can see that c = - 8. Therefore, the y-intercept is - 8. We can also write it as (0,- 8).
b
The points where a graph crosses the x-axis are called the x-intercepts. Let's find them on our graph!
As we can see, the x-intercepts of the given function are (- 2,0) and (4,0).
c
Because a parabola either opens upward or downward, there is always one point that is the absolute maximum or absolute minimum of the function. This point is called the vertex. Since the parabola of the given function opens upward, the vertex will be the lowest point of the graph. Let's find it!
As we can see, the vertex of the given function is (1,- 9).