4. Transformations of Linear Functions
Sign In
An error ocurred, try again later!
Chapter 3
4.
Transformations of Linear Functions
Dylan and Emily dive into the world of linear functions, aiming to design a sports video game. They learn about translating linear functions to adjust the size of the playing court. Translations, both vertical and horizontal, allow them to move functions without altering their shape. Emily, an avid jogger, uses linear functions to track her jogging progress. One day, she invites Heichi for a jog and decides to give him a head start, showcasing the real-world application of translating functions. Through these experiences, they discover that linear transformations are essential tools for various scenarios, from game design to tracking physical activities.
Show less Show more expand_more 


Lesson Settings & Tools
| | 10 Theory slides |
| | 10 Exercises - Grade E - A |
| | Each lesson is meant to take 1-2 classroom sessions |
Transformations of Linear Functions
Slide of 10
All linear functions share the characteristic of having a constant rate of change. It is often required to relate different linear functions by means of transformations, which will be discussed in this lesson.
Catch-Up and Review
Here are a few recommended readings before getting started with this lesson.
Explore
Share
Report error
Translating a Linear Function
Consider the linear function f(x)=2x+1. The applet below shows how transformations can be used to translate the graph of the given function. Two points of the graph will be shown to keep track of the transformation.
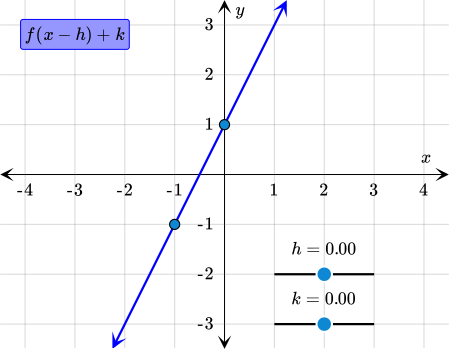 It can be noted that changing the h value moves the graph horizontally. Likewise, changing the k value moves the graph vertically. Is there a way of relating a horizontal translation and a vertical translation?
Discussion
Share
Report error
Function Families and Parent Functions
Functions can be grouped according to their characteristics.
A function family is a group of functions that have similar characteristics. A parent function is the most basic function in a function family. The most common parent functions are those of linear functions, absolute value functions, quadratic functions, and exponential functions.
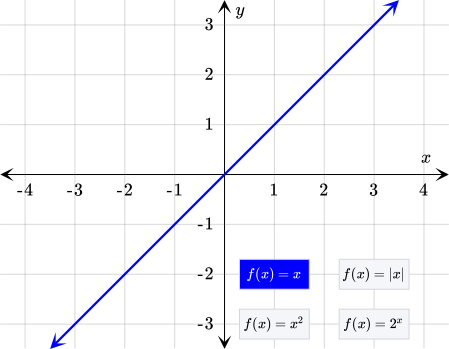
Discussion
Share
Report error
Translation
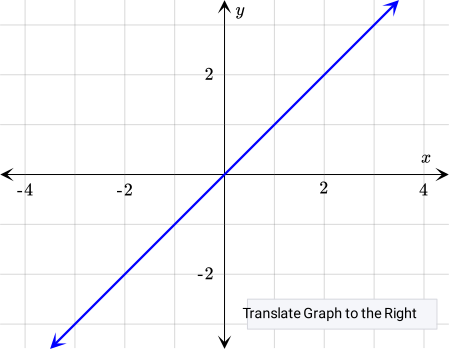
In the previous applet, the whole graph was moved without changing its shape or orientation by changing the h and k values. This is known as a translation.
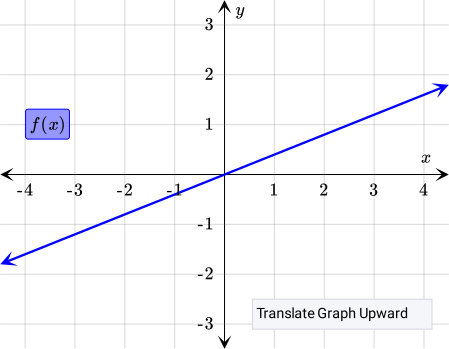
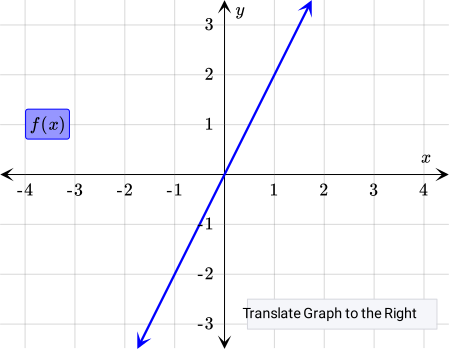
A translation of a function is a transformation that moves a function graph in some direction, without any rotation, shrinking, or stretching. A function's graph is vertically translated by adding a number to — or subtracting from — the function rule.
g(x)=f(x) ± k
g(x)=f(x± h)
| Translations of f(x) | |
|---|---|
| Vertical Translations | Translation up k units, k>0 y=f(x)+k |
| Translation down k units, k>0 y=f(x)-k | |
| Horizontal Translations | Translation to the right h units, h>0 y=f(x-h) |
| Translation to the left h units, h>0 y=f(x+h) | |
Why
Why the Graph is Translated?Consider adding a number k to a function rule.
g(x) = f(x) + k
If k is positive, this operation increases the value of the output for every x, moving the graph upward. Similarly, if k is negative, then the graph is moved downward, because the output of the function is decreased.
 Now consider subtracting a number h from the input.
g(x) = f(x - h)
If h is positive, then the value of the input is reduced. Therefore, greater x-values are needed to obtain the original output, leading to a translation to the right. In contrast, when h is negative, the input value is increased. This means that smaller inputs are needed to obtain the original output. This leads to a translation to the left.
Now consider subtracting a number h from the input.
g(x) = f(x - h)
If h is positive, then the value of the input is reduced. Therefore, greater x-values are needed to obtain the original output, leading to a translation to the right. In contrast, when h is negative, the input value is increased. This means that smaller inputs are needed to obtain the original output. This leads to a translation to the left.
Example
Share
Report error
Adjusting a Savings Plan
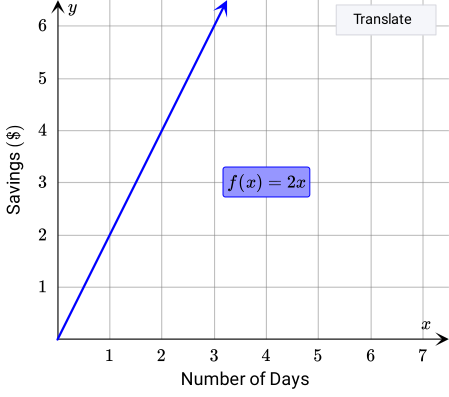
Dylan wants to buy a new set of canvases. He plans to save $2 each day, starting tomorrow. His math teacher told him that linear functions can be used to make a savings plan and provided him with the following graph.
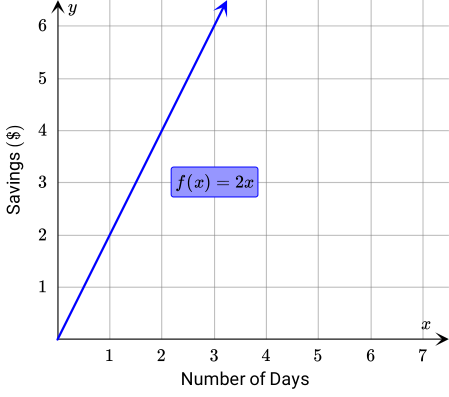
Here, x is the number of days that have passed since Dylan started saving and f(x) is the total amount saved.
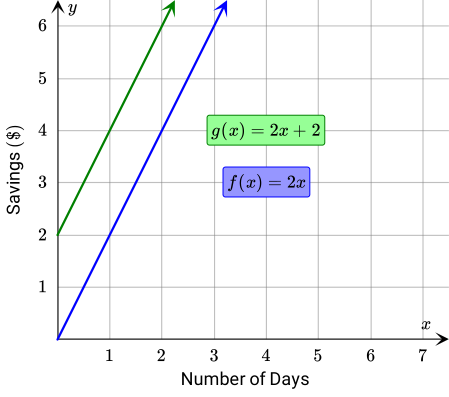
a Dylan plans to ask his parents for some money for his initial savings. If they give him $2, write the function rule that adjusts to this new plan and graph it along with the original function.
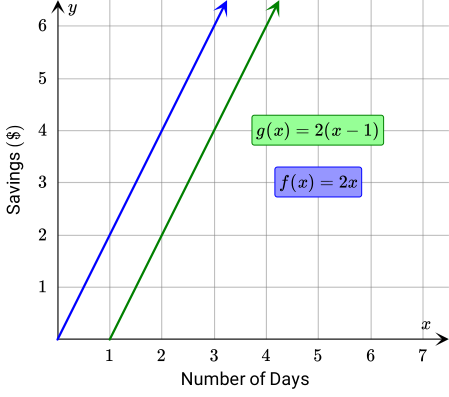
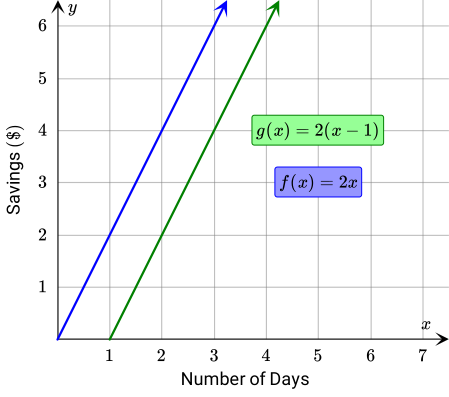
b Instead of asking for money, Dylan decides that he will go out tomorrow to buy a new brush for $2, meaning that he will not be able to start saving until the day after tomorrow. Write the function that adjusts to this new plan and graph it along with the original function.
Answer
a Function: g(x)=2x+2
Graph:
b Function: g(x)=2(x-1)
Graph:
Hint
a Dylan will start with $2 and will still be saving $2 each day.
b Dylan will have to delay his original plan by 1 day.
Solution
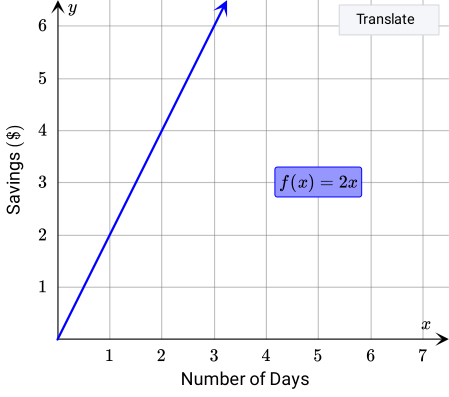
a Dylan's original savings plan was modeled by the following linear function with the assumption that he would not have any initial savings.
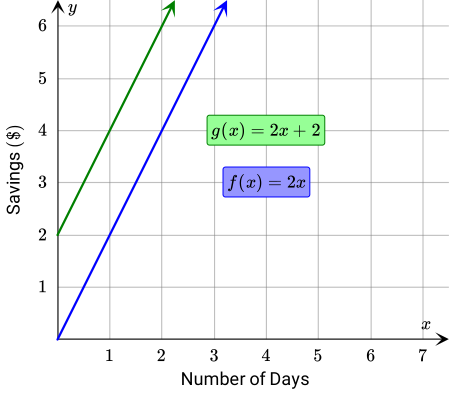
b If Dylan goes tomorrow to buy a new brush for $2, he will not be able to save money that day and his savings plans will be delayed by 1 day. Therefore, he can draw the graph of his saving plans starting at x=1 instead of starting at x=0. This means the graph of the original savings plan has to be translated 1 unit to the right.
Example
Share
Report error
Keeping Track of a Jogging Course
Every Monday afternoon, Emily likes to go jogging in the park next to her job. She uses the pine tree seen in the diagram as her starting point to keep track of her progress.

Following her physics teacher's advice, Emily wrote and graphed a linear function d(t) that models the distance in meters to the right of the pine tree that she has jogged. Here, t is the time in seconds since the start of her run.
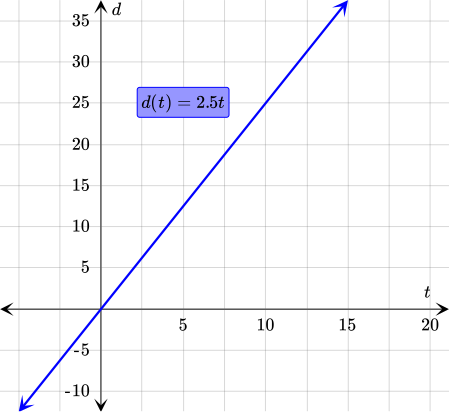
One day, she decided to invite Heichi to join her. Since Heichi is not used to jogging, Emily said that she will give him a head start. Emily will start 10 seconds later, and also she will start from the fountain, which she knows is 5 meters away from the pine.

{"type":"text","form":{"type":"math","options":{"comparison":"1","nofractofloat":false,"keypad":{"simple":false,"useShortLog":false,"variables":["t"],"constants":[]},"rendered":false},"text":" "},"formTextBefore":"g(t)=","formTextAfter":null,"answer":{"text":["2.5(t-10)-5","2.5t-30"]}}
Hint
Both a vertical and a horizontal translation will be needed.
Solution
Emily's jog is normally modeled by the following function.
d(t)=2.5t
Here, t is the time in seconds since Emily started jogging. Since she is giving Heichi a head start, she will start jogging 10 seconds after Heichi starts jogging. This means that at t=10, her distance jogged will be 0 meters, so the graph has to pass through (10,0). This can be done by translating the original graph 10 units to the right.
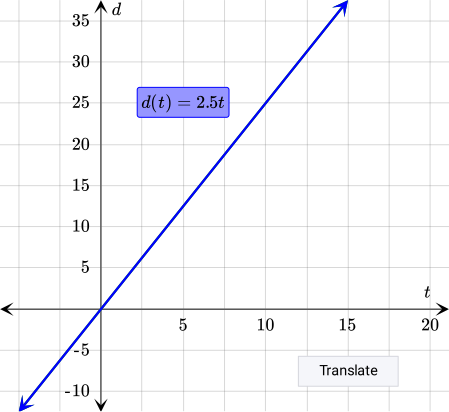 Furthermore, she will start from the fountain, 5 meters left of the pine tree, which is Heichi's starting point. Therefore, at t=10, Emily will be 5 meters to the left of the pine tree. This can be thought as her distance to the tree being -5 meters, so the graph has to pass through (10,-5). To achieve this, translate the previous graph 5 units down.
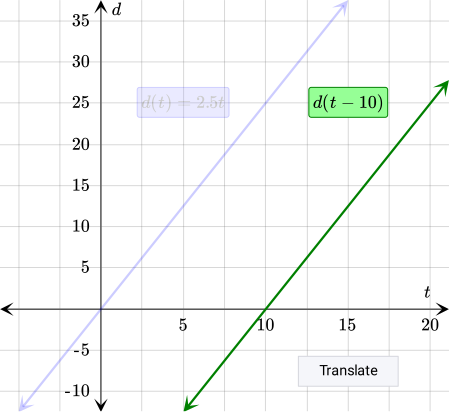 Therefore, the function g(t) that models Emily's new jog is obtained by translating d(t) 10 units to the right and 5 units down.
g(t)=d(t-10)-5 ⇓ g(t)=2.5(t-10)-5
Therefore, the function g(t) that models Emily's new jog is obtained by translating d(t) 10 units to the right and 5 units down.
g(t)=d(t-10)-5 ⇓ g(t)=2.5(t-10)-5
Example
Share
Report error
Early Stage of Video Game Design
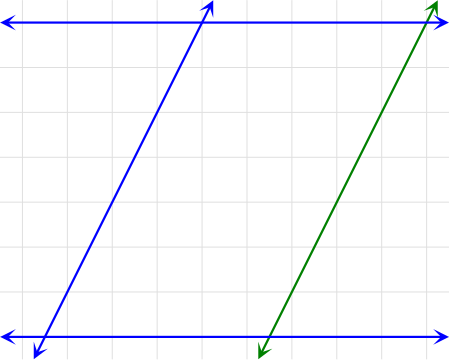
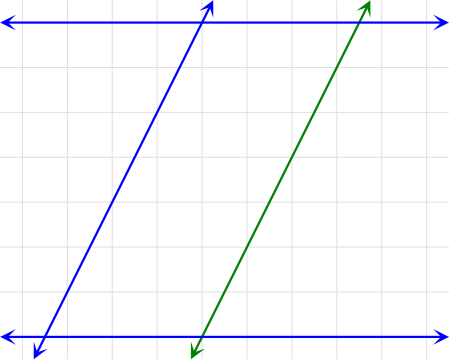
Dylan and Emily are designing a sports video game. In order to draw different playing courts, they need to be able to freely move linear functions according to a function rule that is to be interpreted by a computer.
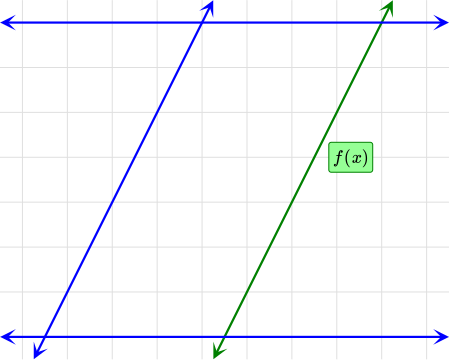
In this stage of design, they are interested in translating f(x). This will let them adjust the size of the playing court.
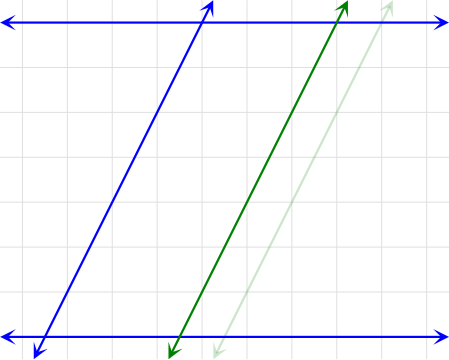
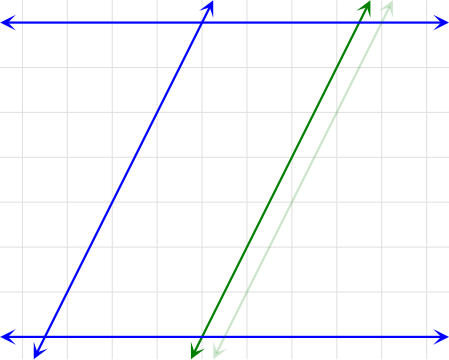
a Draw the graph of f(x) translated 1 unit to the left.
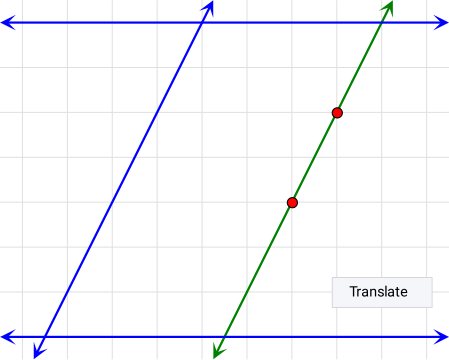
b Draw the graph of f(x) translated 2 units down.
c Draw the graph of f(x) translated 1 unit to the right and 3 units up.
Answer
a Graph:

b Graph:
c Graph:
Hint
a Two points define a unique line. This means that two points can be translated to find the translation of the linear function.
b Use two appropriate points of the original function as a reference for the translation.
c The translations can be done each one at a time.
Solution
a Two points can be used to define a unique line. This fact can be used to help with the translation of the graph. Start by identifying two arbitrary points in the graph of f(x).
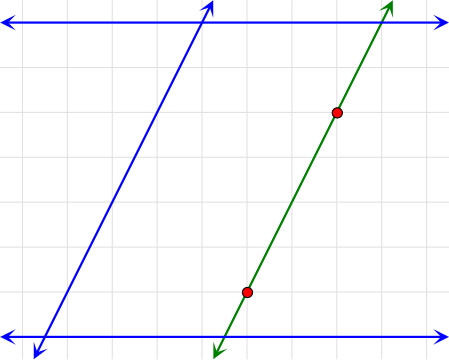
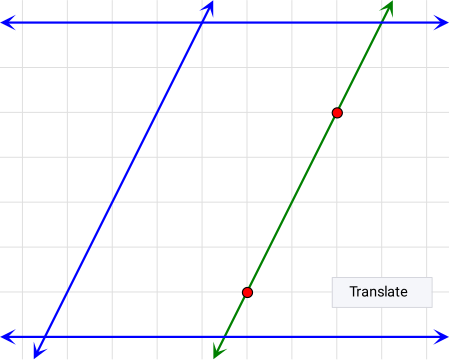
b Two points will be used as a reference again for this translation. This time the translation is two units down, so it might be better to choose a different pair of points.
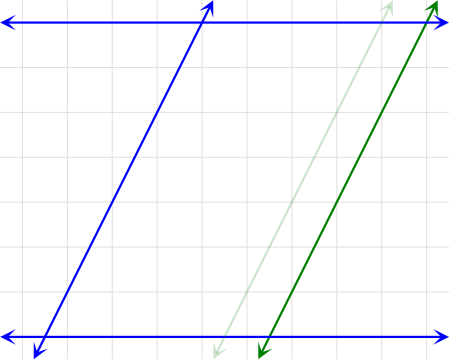
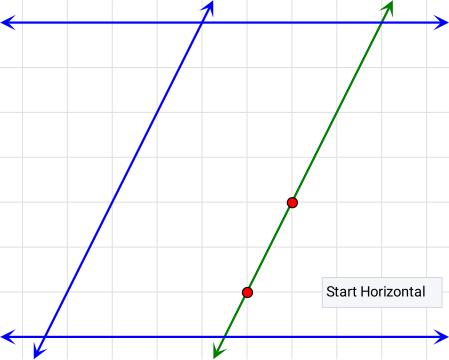
c This time two translations are involved. These can be done one at a time. One way of doing it is by starting by the translation by one unit to the right, then translating the new line up by three units. The same result can be obtained by starting with the vertical translation followed by the horizontal one.
Pop Quiz
Share
Report error
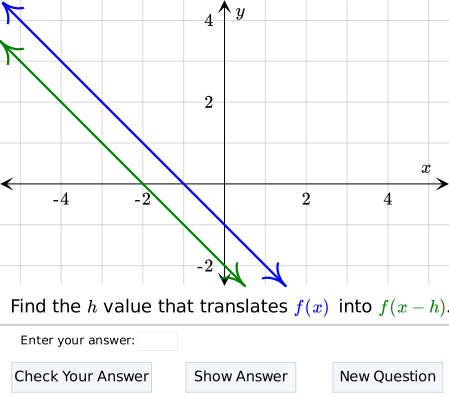
Identifying Horizontal Translations
The linear functions shown in the following diagram are related by a translation. Be careful with the sign of h.
Pop Quiz
Share
Report error
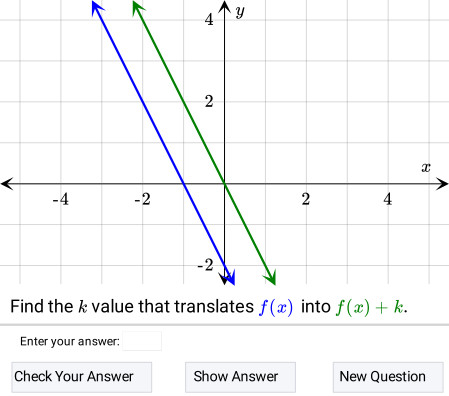
Identifying Vertical Translations
The linear functions shown in the following diagram are related by a translation.
Closure
Share
Report error
Relating Vertical and Horizontal Translations of Linear Functions
Horizontal and vertical translations of linear functions have the particular characteristic of being related to each other. In the following applet, a horizontal translation can be done to the linear function by dragging the red point. The blue point will keep track of the vertical translation of the function.
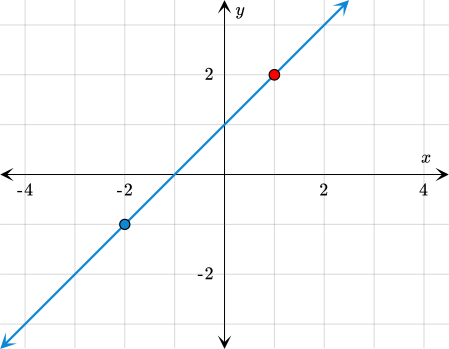 In this case, a horizontal translation to the right can also be seen as a vertical translation down the same number of units. The slope of the linear function plays a major role in this. Now consider a linear function with a different slope.
 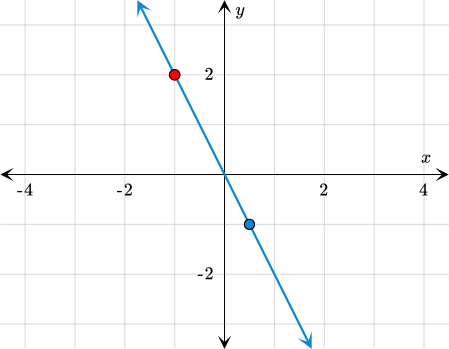 This time, a horizontal translation to the right can also be seen as a vertical translation up of twice the number of units. To make sense of this, consider the slope-intercept form of a linear function.
y=mx+b
A horizontal translation can be done to this function by substituting x-h for x.
y=m(x-h)+b
By doing some algebra, it can be shown that this horizontal translation can be written as a vertical translation.
Therefore, a horizontal translation of h units can be seen as a vertical translation of mh units — down or up, depending on the sign of mh.
This time, a horizontal translation to the right can also be seen as a vertical translation up of twice the number of units. To make sense of this, consider the slope-intercept form of a linear function.
y=mx+b
A horizontal translation can be done to this function by substituting x-h for x.
y=m(x-h)+b
By doing some algebra, it can be shown that this horizontal translation can be written as a vertical translation.
Therefore, a horizontal translation of h units can be seen as a vertical translation of mh units — down or up, depending on the sign of mh.
Transformations of Linear Functions
Exercise 2.1
The graph of g(x)=x+3 is a vertical translation 4 units up of the graph of f(x)=x-1. Which of the following transformations describes how to obtain the graph of g(x) from the graph of f(x) using a horizontal translation?
A. & Horizontal translation3 units to the left
B. & Horizontal translation3 units to the right
C. & Horizontal translation4 units to the left
D. & Horizontal translation4 units to the right
{"type":"choice","form":{"alts":["A","B","C","D"],"noSort":true},"formTextBefore":"","formTextAfter":"","answer":2}
security
report
code
security
report
code
Let's graph f(x)=x-1 and g(x)=x+3 on the same coordinate plane. To draw the graph of g(x) we need to vertically translate the graph of f(x) 4 units up.
Let's see how many units we need to translate horizontally the graph of f(x) to get the graph of g(x).
In addition to being a vertical translation 4 units up, we can see that the graph of g(x) is a horizontal translation 4 units to the left of the graph of f(x). We write a horizontal translation by subtracting a number h from a function's input before evaluating. y=f(x- h) An h-value of less than 0 represents a shift of the original function to the left. Conversely, a value of h greater than 0 means a shift to the right. Since the translation we want is a translation 4 units to the left, we need to subtract -4 from the input. f(x-( - 4)) [0.3em] ⇕ [0.3em] f(x+4) Finally, let's evaluate f(x) at x+4. f(x+4) = ( x+4)-1 [0.3em] ⇕ [0.3em] f(x+4) = x+3_(g(x)) We showed that a horizontal translation 4 units to the left and a vertical translation 4 units up of the graph of f(x)=x+1 have the same output. Therefore, the answer is C.
security
report
code
Dylan has $40 to spend on fabric for making canvases. The amount m, in dollars, that he has after buying x yards of fabric is given by the following function. m(x)=40-8x
{"type":"text","form":{"type":"math","options":{"comparison":"1","nofractofloat":false,"keypad":{"simple":false,"useShortLog":false,"variables":["x"],"constants":[]},"rendered":false},"text":" "},"formTextBefore":"g(x)=","formTextAfter":null,"answer":{"text":["55-8x","-8x+55"]}}
{"type":"text","form":{"type":"math","options":{"comparison":"1","nofractofloat":false,"keypad":{"simple":false,"useShortLog":false,"variables":["x"],"constants":[]},"rendered":false},"text":" "},"formTextBefore":"g(x)=","formTextAfter":null,"answer":{"text":["30-8x","-8x+30"]}}
security
report
code
security
report
code
We are given the following function. m(x) = 40 - 8x Here, the input x represents the amount of fabric bought by Dylan and the output m(x) represents the money he has left after buying x yards of fabric. This means that the amount of money he will have left after buying the fabric depends on how much fabric he buys. Money After Buying Fabric m(x) dollars Since Dylan received an additional $ 15, he now has m(x)+ 15 dollars — that is, to represent the new amount of money that Dylan has, we have to add 15 to the output of m(x). What a lucky guy! New Amount of Money g(x) = m(x) + 15 ⇓ g(x) = 40 - 8x + 15 ⇓ g(x) = 55-8x
This time Dylan spent $ 10 on a new set of brushes, so he now has m(x) -10 dollars — that is, to represent the new amount of money that Dylan has, we have to subtract 10 from the output of m(x).
New Amount of Money
g(x) = m(x) -10 ⇓
g(x) = 40 - 8x - 10 ⇓
g(x) = 30-8x
security
report
code
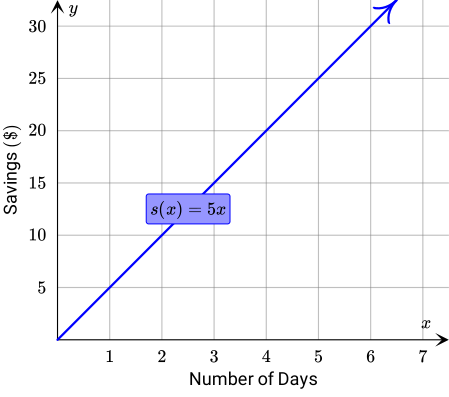
Zain plans to save $5 each day in order to buy a new baseball bat. The following graph represents their savings.
{"type":"choice","form":{"alts":["A","B","C","D"],"noSort":true},"formTextBefore":"","formTextAfter":"","answer":3}
security
report
code
security
report
code
Let's take another look at the original graph. Since the graph starts at x=0 and Zain does not start with any savings, we will start our graph at the origin of the coordinate plane.
We are told that Zain's savings plans will be delayed by 2 days, so the graph of their savings will start at x=2 instead of x=0. This means that the graph of the original savings plan has to be horizontally translated 2 units to the right. Let's mark this new start with a point at (2,0).
Next, we will plot more points of the graph. Note that we will translate each point of the original graph 2 units to the right in our coordinate plane.
Finally, we join the points and draw a straight line.
Therefore, the answer is D.
security
report
code
Transformations of Linear Functions
Recommended exercises
To get personalized recommended exercises, please login first.
Loading content
≤
>
■2
■▢
e▢
7
8
9
×
÷■1
=
=
√▢
▢√
∫▢▢
4
5
6
+
−
≤
<
log
ln
log▢
1
2
3
()
∣
sin
cos
tan
0
.
π
x
y
Loading content