2. Probabilities with Multiple Events
Sign In
An error ocurred, try again later!
Chapter 12
2.
Probabilities with Multiple Events
Understanding probabilities with multiple events is essential for analyzing situations involving uncertainty. This lesson introduces sample spaces and tree diagrams to visualize possible outcomes. It also explores compound events, which involve multiple conditions or scenarios, and demonstrates how simulations can be used to model and analyze probabilities in real-world contexts. By mastering these concepts, students can solve complex probability problems and apply these skills to fields like statistics, science, and decision-making.
Show less Show more expand_more 


Lesson Settings & Tools
| | 11 Theory slides |
| | 10 Exercises - Grade E - A |
| | Each lesson is meant to take 1-2 classroom sessions |
Probabilities with Multiple Events
Slide of 11
Events are typically not isolated, and they can occur along with other events. The concept of compound event is used to understand the odds of two or more events happening together. Compound events are used to describe a wider variety of scenarios using the basics of probability. This lesson will discuss compound events and some tools that are useful when studying them.
Catch-Up and Review
Here are a few recommended readings before getting started with this lesson.
Challenge
Getting the Right Coffee
One particular Sunday morning, Magdalena went out with her parents to do the groceries. On their way back to home, they stopped at a drive-thru coffee shop to get some drinks. As they were on the ordering screen, Magdalena got a text from her sister, asking her for a coffee. Unfortunately, she did not elaborate on how she would like her coffee.


{"type":"text","form":{"type":"math","options":{"comparison":"1","nofractofloat":false,"keypad":{"simple":true,"useShortLog":false,"variables":[],"constants":[]},"rendered":false},"text":"<span class=\"katex\"><span class=\"katex-html\" aria-hidden=\"true\"><\/span><\/span>"},"formTextBefore":null,"formTextAfter":null,"answer":{"text":["1\/40"]}}
Discussion
Sample Space
The sample space of an experiment is the set of all possible outcomes. For example, when flipping a coin, there are two possible outcomes: heads, H, or tails, T. Therefore, the sample space is {H,T}.

Example
Picking the Ingredients for a Sandwich
Magdalena and her family have a very diverse taste on sandwiches. For example, Magdalena likes a simple ham sandwich made with white bread. On the other hand, her dad likes a roast beef rye sandwich. Because of this, they usually buy three different types of deli meat: roast beef, ham, and turkey.
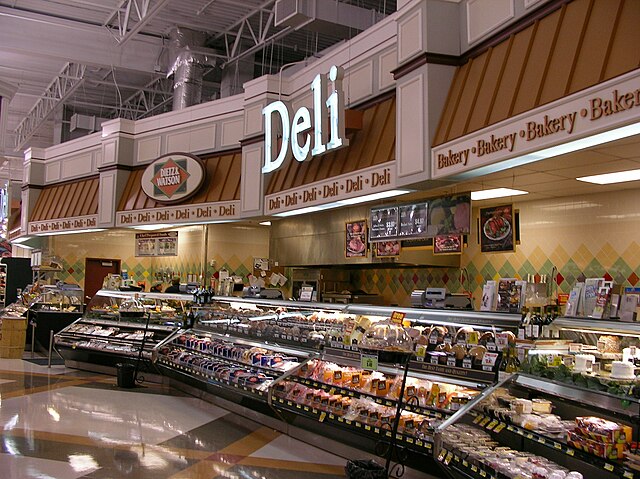 On the bread side, everyone likes white bread aside from her dad, who prefers rye bread. Magdalena wonders how many different sandwiches can be made from these ingredients.
 Write the sample space of all the possible sandwiches that can be made using white bread, rye bread, roast beef, ham, or turkey. Assume that only one type of deli meat can be used on each. How many different sandwiches can be made?
 {"type":"text","form":{"type":"math","options":{"comparison":"1","nofractofloat":false,"keypad":{"simple":true,"useShortLog":false,"variables":[],"constants":[]},"rendered":false},"text":"<span class=\"katex\"><span class=\"katex-html\" aria-hidden=\"true\"><\/span><\/span>"},"formTextBefore":null,"formTextAfter":null,"answer":{"text":["6"]}}
Hint
Use different combinations of letters to represent each type of sandwich. For example, let WR be a roast beef sandwich made with white bread. Count how many different combinations can be written.
Solution
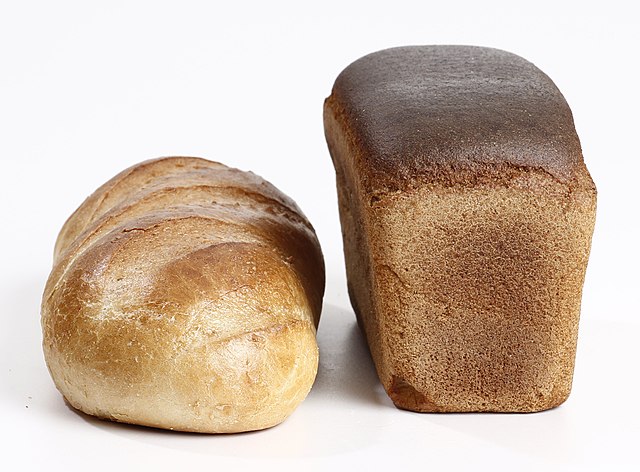
There are two different bread options for the sandwich, white bread an rye bread. The first letter of each type of bread can be used to represent which one will be used in a sandwich.
White→WRye→R
Similarly, the first letter of each type of deli meat can be used.
Roast Beef→RHam→HTurkey→T
Notice that the letter R is used both for rye bread and for roast beef. This is not a problem at all as long as it is understood that the first letter corresponds to the bread, and the second letter to the deli meat. Knowing this, the sample space can now be written. Keep in mind that no deli meat is to be repeated.
{WR, WH, WT, RR, RH, RT}
Now that the sample space has been written, the number of elements can be counted. There are a total of 6 different sandwiches that can be made from the given options of bread and deli meat!
Discussion
Tree Diagrams
A tree diagram is an illustration of all the possible combinations that can be made from a given set of objects. Tree diagrams are useful for obtaining the sample space of an experiment when multiple choices are available. As an example, consider the different pasta recipes that can be made with different types of pasta, sauce, and cheese.

Example
Adding Cheese to the Sandwiches
Magdalena's family also likes different types of cheese. From the wide variety of existing cheese available, they typically buy American, Swizz, and provolone. 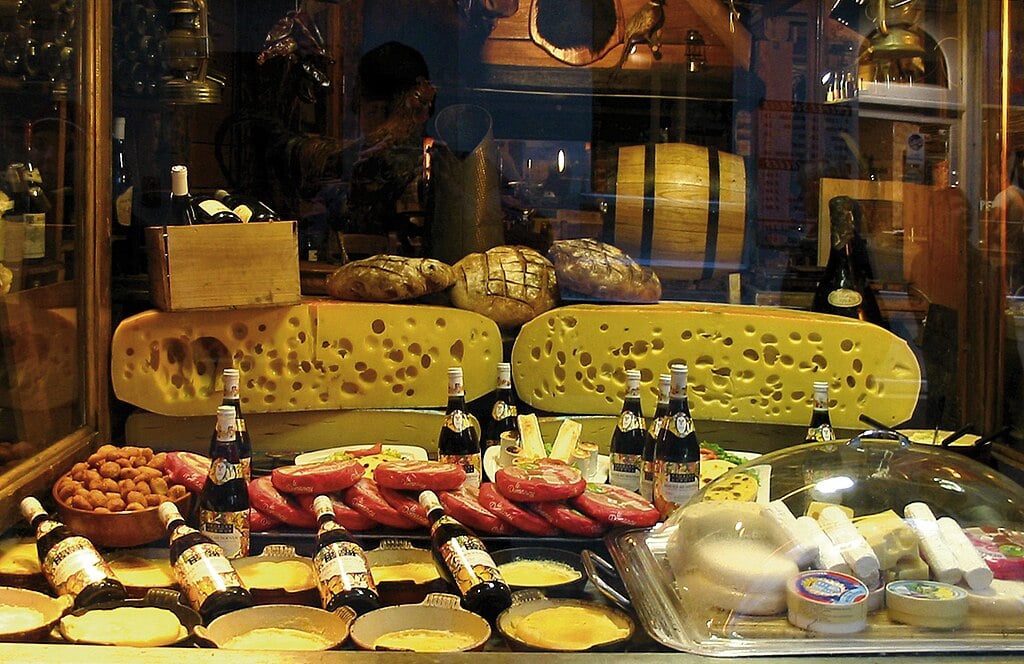 Magdalena now wonders how many different sandwiches can be made using the different types of bread, deli meat, and cheese. Assume that only one type of deli meat and cheese can be used. Use a tree diagram to find how many different sandwiches can be made from the above ingredients.


 The sample space consists of 18 elements. This means that 18 different sandwiches can be made with the given ingredients. Notice that the same result can be found by multiplying the number of options in each category. There are 2 different types of bread, 3 different deli meats, and 3 different cheeses.
 Magdalena now wonders how many different sandwiches can be made using the different types of bread, deli meat, and cheese. Assume that only one type of deli meat and cheese can be used. Use a tree diagram to find how many different sandwiches can be made from the above ingredients.
 {"type":"text","form":{"type":"math","options":{"comparison":"1","nofractofloat":false,"keypad":{"simple":true,"useShortLog":false,"variables":[],"constants":[]},"rendered":false},"text":"<span class=\"katex\"><span class=\"katex-html\" aria-hidden=\"true\"><\/span><\/span>"},"formTextBefore":null,"formTextAfter":null,"answer":{"text":["18"]}}
Hint
There are three categories to consider when making the sandwich: bread, deli meat, and cheese. When moving to the next category, all the options need to be repeated.
Solution
Adding cheese as an ingredient for the sandwiches makes the task of finding the sample space a little harder. A tree diagram can provide a useful visual aid. Use the tree diagram to find how many different combinations of bread, meat, and cheese can be made from the given options. Begin by listing the two bread options.
Next, list the three options for the deli meat next to each bread option. Use segments to connect both bread types to each of the deli meats available.
Similarly, next to each meat option list the three cheese options. Draw segments connecting meat options to cheese options.
Each possible outcome is represented by a path in the tree diagram. Use the first letter of each ingredient to represent all the possible sandwiches that can be made with the given ingredients. This way, the sample space can be obtained.
2⋅3⋅3=18
Discussion
Compound Event
A compound event is an event that is a combination of two or more events. Below is an example.
first eventA coin is flipped and a die is rolledsecond event.
The number of elements of the sample space of the compound event can be found by multiplying the number of possible outcomes of each individual event. | Event | Number of Outcomes |
|---|---|
| Flipping a coin | 2 |
| Rolling a die | 6 |
| Flipping a coin and rolling a die | 2×6=12 |
In the above example, one possible outcome of the compound event is flipping a tails and rolling a 3. To find the probability of this outcome, divide this one possibility by the number of possible outcomes of the compound event.
P(Flipping a tails and rolling a 3)=121
Example
Will Mom Like the Sandwich?
Magdalena knows that her mom loves provolone cheese. She even usually eats some slices of ham with olives as a snack! Magdalena now asks her mom what is her favorite type of meat.

Magdalena recalled that only her dad likes rye bread, so her mom should like white bread. Magdalena decided to use the tree diagram she made when exploring all the possible sandwiches.

{"type":"text","form":{"type":"math","options":{"comparison":"1","nofractofloat":false,"keypad":{"simple":true,"useShortLog":false,"variables":[],"constants":[]},"rendered":false},"text":"<span class=\"katex\"><span class=\"katex-html\" aria-hidden=\"true\"><\/span><\/span>"},"formTextBefore":null,"formTextAfter":null,"answer":{"text":["1\/9"]}}
Solution
Consider the given tree diagram.

To find the probability that Magdalena's mom likes a sandwich made from random ingredients, the number of favorable outcomes needs to be divided by the total number of outcomes. Magdalena's mom prefers white bread.

From here, the meat can be either roast beef or turkey. Highlight these options in the tree diagram.

From both of these points, continue to the branches that contain provolone cheese.

Probability=182
Notice that the above fraction can be simplified.
182
Rewrite
Rewrite 18 as 2⋅9
2⋅92
CancelCommonFac
Cancel out common factors
2⋅92
SimpQuot
Simplify quotient
91
Discussion
Simulation
A simulation is a model that imitates a real-life process or situation. In particular, a simulation can be used as a probability model to make predictions about real-life events. Consequently, the experimental probability can be estimated by simulating the events.
P(event)=Number of trialsNumber of times event occurs
In general, simulations are used when actual trials of some experiment are impossible or unreasonable to conduct.Example
The Crane Game
As Magdalena and her parents were leaving from the groceries store, Magdalena saw a crane game filled with cute plush dolls.
 Playing the crane game costs $1, and Magdalena has $5, so she asks her dad if she can play. Magdalena's dad says that the odds of winning a plush doll are about 1 in 10, so he says that it is not worth it.

Successful Attempt:Failed Attempt: 9 0,1,2,3,4,5,6,7, or 8
Since Magdalena had $5, five random numbers will be generated in succession. To obtain more relevant results, the experiment will be repeated 20 times. Imagine spending that much money on a crane game! Magdalena now runs the simulation and obtains the following numbers.
5056652189222075333484909175596520353733823473129377876118527361961241803785071008484082600042822341
Using the data from the simulation, what is the experimental probability of getting at least one plush doll when spending $5 to play the crane game? {"type":"text","form":{"type":"math","options":{"comparison":"1","nofractofloat":false,"keypad":{"simple":true,"useShortLog":false,"variables":[],"constants":[]},"rendered":false},"text":"<span class=\"katex\"><span class=\"katex-html\" aria-hidden=\"true\"><\/span><\/span>"},"formTextBefore":null,"formTextAfter":null,"answer":{"text":["1\/4"]}}
Solution
Since a 9 represents getting a plush doll from the crane game, begin by identifying which trials contain at least one 9.
The simulation showed that the experimental probability of getting at least one plush doll from the crane game is 41. This probability can be written as a percentage.
5056652189222075333484909175596520353733823473129377876118527361961241803785071008484082600042822341
There were 5 successes out of the 20 trials that were simulated. Find the experimental probability of getting at least one plush doll from the crane game by dividing the number of successes by the number of trials.
P(getting at least a plush doll)=205
Notice that the above fraction can be simplified.
205
Rewrite
Rewrite 20 as 5⋅4
5⋅45
CancelCommonFac
Cancel out common factors
5⋅45
SimpQuot
Simplify quotient
41
41=25%
Keep in mind that by doing a different simulation different probabilities can be found.
Closure
A Lucky Coffee
Magdalena was previously found in the predicament of having people waiting on the line of the drive-thru coffee while not knowing exactly what her sister wanted.
 A tree diagram can be used to find how many different orders are possible. Since there are plenty of options, the diagram will be huge. Instead, consider that there are 2 options for the type of coffee, 5 options for the type of milk, and 4 options for the sweetener. The number of elements in the sample space can be found by multiplying the number of available options.
2⋅5⋅4=40
This means that Magdalena only has a 1 in 40 chance of getting her Sister's coffee the exact way she likes it. 401
Magdalena decided to order it regular, no milk, with stevia. It was a big surprise finding out that this is exactly how Magadelena's sister likes it! It is more likely that Magdalena unconsciously recalled how her sister orders her coffee. Anyways, we can say this was a very lucky coffee!Probabilities with Multiple Events
Exercise 2.1
Suppose a coin is flipped three times in a row. What is the probability of getting at least one tails?
{"type":"text","form":{"type":"math","options":{"comparison":"1","nofractofloat":false,"keypad":{"simple":true,"useShortLog":false,"variables":[],"constants":[]},"rendered":false},"text":"<span class=\"katex\"><span class=\"katex-html\" aria-hidden=\"true\"><\/span><\/span>"},"formTextBefore":null,"formTextAfter":null,"answer":{"text":["7\/8"]}}
security
report
code
security
report
code
We want to find the probability of getting at least one tails when flipping a coin three times in a row. We first need to know the sample space of the experiment before finding the probability. We can start by drawing a tree diagram to help us find the sample space. Begin by writing the different outcomes of the first throw.
We now write the possible outcomes of the second throw next to the outcomes of the previous throw. We will use segments to connect these throws.
Let's do the same for the third throw.
We can now write the sample space of the experiment.
The sample space consists of 8 elements. Getting at least one tails means that we can either have one tails, two tails, or three tails. Let's highlight these outcomes from our tree diagram.
Note that we have 7 different ways of getting at least one tails. Find the probability of this event by dividing 7 by the number of possible outcomes. 7/8
security
report
code
A six-sided die is rolled two times. What is the probability that the numbers rolled add up to 11?
{"type":"text","form":{"type":"math","options":{"comparison":"1","nofractofloat":false,"keypad":{"simple":true,"useShortLog":false,"variables":[],"constants":[]},"rendered":false},"text":"<span class=\"katex\"><span class=\"katex-html\" aria-hidden=\"true\"><\/span><\/span>"},"formTextBefore":null,"formTextAfter":null,"answer":{"text":["2\/36","1\/18"]}}
security
report
code
security
report
code
We are told that a six-sided die is rolled two times, and we are asked to find the probability that the numbers rolled add up to 11. We first need to know how many elements there are in the sample space. Because there are plenty of outcomes, making a tree diagram would take a lot of space. Instead, we multiply the number of possible outcomes of each roll. 6 * 6 = 36 The given experiment has 36 different outcomes. Since we are interested in the sum of the rolls, we will inspect in which cases the sum of rolled numbers is 11. This can only happen when we roll a combination of the numbers 5 and 6. 5+6 &= 11 6+5 &= 11 Note that if either die rolls less than 5, then it is not possible to obtain a sum of 11. This means that there are only 2 favorable outcomes. Knowing this, we can find the requested probability by dividing the number of favorable outcomes by the number of all possible outcomes. 2/36 Notice that the above fraction can be simplified.
The probability of getting the die to add up to exactly 11 in two throws is 118.
security
report
code
Magdalena's cat is pregnant. The vet says that she is expecting triplets! Suppose that each kitty has an equal chance to be born male or female. What are the odds that Magdalena's cat gives birth to at least one male and one female kitty?
{"type":"text","form":{"type":"math","options":{"comparison":"1","nofractofloat":false,"keypad":{"simple":true,"useShortLog":false,"variables":[],"constants":[]},"rendered":false},"text":"<span class=\"katex\"><span class=\"katex-html\" aria-hidden=\"true\"><\/span><\/span>"},"formTextBefore":null,"formTextAfter":null,"answer":{"text":["3\/4","6\/8"]}}
security
report
code
security
report
code
We are told that Magdalena's cat is about to give birth to three kitties. To find the probability that she gives birth to at least one male and a female kitty, we will first write the sample space of this experiment. Let's make a tree diagram! We begin by listing the possible outcomes of the first born kitty.
We now list the possibilities of the second kitty and use segments to connect to their sibling.
The third birth is listed in a similar way.
Finish the diagram by listing each element of the sample space.
Now, let's look at the sample space and find the outcomes that contain at least one male and one female kitty. We will highlight these outcomes.
There are 6 out of 8 possible outcomes where there is at least one male and one female kitty. The quotient of these numbers is the probability of this compound event. 6/8 Notice that we can simplify this fraction.
security
report
code
Magdalena asked her sister if she could borrow her laptop while her sister was out in the mall with her friends. The sister said that it was fine, but she forgot to tell Magdalena the password to unlock the laptop. Knowing that the password is a four-digit number, what are the odds of getting the password right in the first try?
{"type":"text","form":{"type":"math","options":{"comparison":"1","nofractofloat":false,"keypad":{"simple":true,"useShortLog":false,"variables":[],"constants":[]},"rendered":false},"text":"<span class=\"katex\"><span class=\"katex-html\" aria-hidden=\"true\"><\/span><\/span>"},"formTextBefore":null,"formTextAfter":null,"answer":{"text":["1\/10000"]}}
security
report
code
security
report
code
We are told that the password is made of four digits. Recall that the digits are the numbers from 0 to 9. 0, 1, 2, 3, 4, 5, 6, 7, 8, 9 This means that there are a total of 10 options for the first digit, then another 10 options for the second, and so on until the password is complete. To find the total number of possible passwords, we need to multiply 10 four times by itself. 10 * 10 * 10 * 10 = 10 000 There are 10 000 possible four-digit passwords. Only 1 of them is the correct one. This information allows us to find the probability of getting the password in the first try. 1/10 000 The probability of getting the password right on the first try is 110 000. It is better if Magdalena calls her sister before the laptop gets blocked!
security
report
code
Probabilities with Multiple Events
Recommended exercises
To get personalized recommended exercises, please login first.
Loading content
≤
>
■2
■▢
e▢
7
8
9
×
÷■1
=
=
√▢
▢√
∫▢▢
4
5
6
+
−
≤
<
log
ln
log▢
1
2
3
()
∣
sin
cos
tan
0
.
π
x
y
Loading content