Sign In
Probabilities with Multiple Events


| | 11 Theory slides |
| | 10 Exercises - Grade E - A |
| | Each lesson is meant to take 1-2 classroom sessions |
Catch-Up and Review
Here are a few recommended readings before getting started with this lesson.
Getting the Right Coffee
One particular Sunday morning, Magdalena went out with her parents to do the groceries. On their way back to home, they stopped at a drive-thru coffee shop to get some drinks. As they were on the ordering screen, Magdalena got a text from her sister, asking her for a coffee. Unfortunately, she did not elaborate on how she would like her coffee.


Sample Space
The sample space of an experiment is the set of all possible outcomes. For example, when flipping a coin, there are two possible outcomes: heads, H, or tails, T. Therefore, the sample space is {H,T}.

Picking the Ingredients for a Sandwich
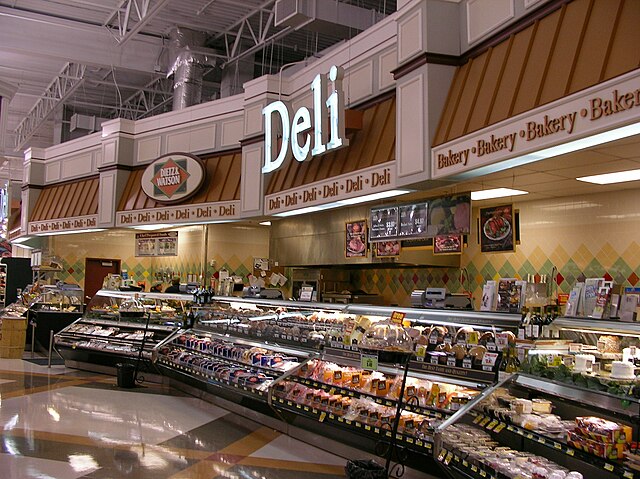 On the bread side, everyone likes white bread aside from her dad, who prefers rye bread. Magdalena wonders how many different sandwiches can be made from these ingredients.
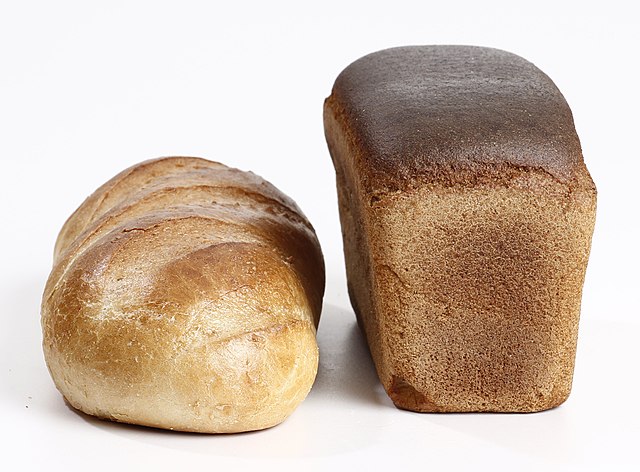 Write the sample space of all the possible sandwiches that can be made using white bread, rye bread, roast beef, ham, or turkey. Assume that only one type of deli meat can be used on each. How many different sandwiches can be made?
 Hint
Use different combinations of letters to represent each type of sandwich. For example, let WR be a roast beef sandwich made with white bread. Count how many different combinations can be written.
Solution
Tree Diagrams
A tree diagram is an illustration of all the possible combinations that can be made from a given set of objects. Tree diagrams are useful for obtaining the sample space of an experiment when multiple choices are available. As an example, consider the different pasta recipes that can be made with different types of pasta, sauce, and cheese.

Adding Cheese to the Sandwiches
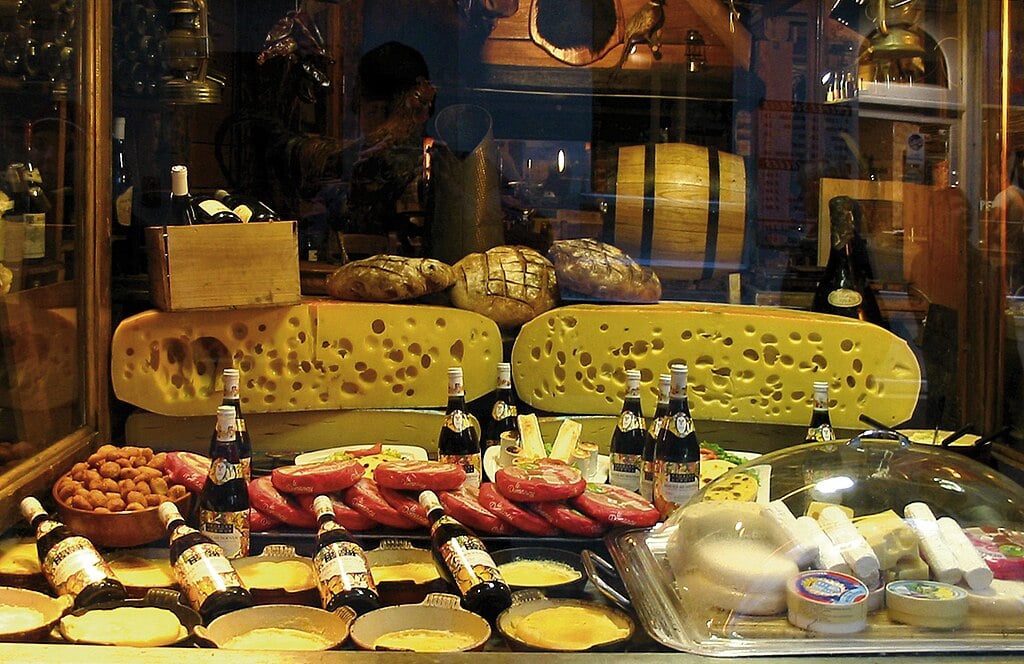 Magdalena now wonders how many different sandwiches can be made using the different types of bread, deli meat, and cheese. Assume that only one type of deli meat and cheese can be used. Use a tree diagram to find how many different sandwiches can be made from the above ingredients.
 Hint
There are three categories to consider when making the sandwich: bread, deli meat, and cheese. When moving to the next category, all the options need to be repeated.
Solution
Adding cheese as an ingredient for the sandwiches makes the task of finding the sample space a little harder. A tree diagram can provide a useful visual aid. Use the tree diagram to find how many different combinations of bread, meat, and cheese can be made from the given options. Begin by listing the two bread options.

Next, list the three options for the deli meat next to each bread option. Use segments to connect both bread types to each of the deli meats available.

Similarly, next to each meat option list the three cheese options. Draw segments connecting meat options to cheese options.

Each possible outcome is represented by a path in the tree diagram. Use the first letter of each ingredient to represent all the possible sandwiches that can be made with the given ingredients. This way, the sample space can be obtained.

Compound Event
| Event | Number of Outcomes |
|---|---|
| Flipping a coin | 2 |
| Rolling a die | 6 |
| Flipping a coin and rolling a die | 2×6=12 |
In the above example, one possible outcome of the compound event is flipping a tails and rolling a 3. To find the probability of this outcome, divide this one possibility by the number of possible outcomes of the compound event.
Will Mom Like the Sandwich?
Magdalena knows that her mom loves provolone cheese. She even usually eats some slices of ham with olives as a snack! Magdalena now asks her mom what is her favorite type of meat.

Magdalena recalled that only her dad likes rye bread, so her mom should like white bread. Magdalena decided to use the tree diagram she made when exploring all the possible sandwiches.

Solution
Consider the given tree diagram.

To find the probability that Magdalena's mom likes a sandwich made from random ingredients, the number of favorable outcomes needs to be divided by the total number of outcomes. Magdalena's mom prefers white bread.

From here, the meat can be either roast beef or turkey. Highlight these options in the tree diagram.

From both of these points, continue to the branches that contain provolone cheese.

Rewrite 18 as 2⋅9
Cancel out common factors
Simplify quotient
Simulation
The Crane Game
As Magdalena and her parents were leaving from the groceries store, Magdalena saw a crane game filled with cute plush dolls.
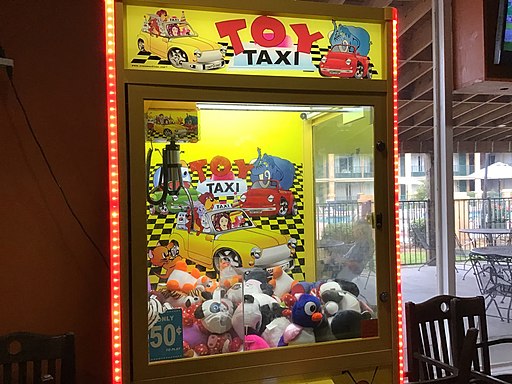 Playing the crane game costs $1, and Magdalena has $5, so she asks her dad if she can play. Magdalena's dad says that the odds of winning a plush doll are about 1 in 10, so he says that it is not worth it.

Solution
Rewrite 20 as 5⋅4
Cancel out common factors
Simplify quotient
A Lucky Coffee

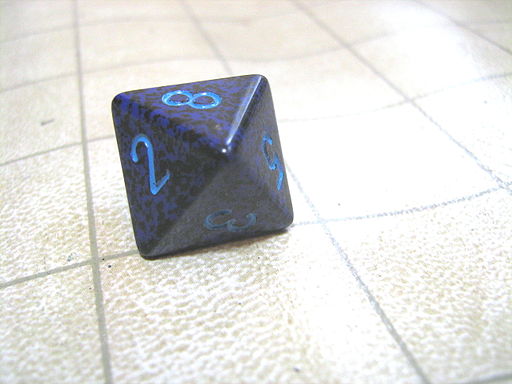 Write the sample space of the possible outcomes of throwing an eight-sided die.
We are told that an eight-sided die has eight faces. A number from 1 to 8 is written on each face, so there are eight possible outcomes. Write the sample space by listing every possibility. {1, 2, 3, 4, 5, 6, 7, 8} Keep in mind that, if the dice is fair, every outcome is equally as likely as the others.
We are asked to write the number of elements in the sample space corresponding to the different pizzas that can be ordered in the restaurant. A tree diagram can help us count these options. Let's begin by writing the different flavors of pizza that the restaurant has to offer.
Next, we list the three options for the size of the pizza next to each flavor. We use segments to connect the flavor and the size of the pizza.
We now write the sample space. We use the first letter of the flavor and the first letter of the size to represent all the possible outcomes.
There are a total of 9 different pizzas that can be ordered in the restaurant.
We are asked to find the probability of getting heads twice in a row when flipping a coin twice. To do so, we will begin by writing the sample space of the experiment. We can use a tree diagram to help us find the sample space. Let's begin by writing the different outcomes of the first throw.
Next, we list the outcomes of the second throw next to each outcome of the first throw. We use segments to connect both throws.
This lets us write the sample space of the experiment.
Since we are interested in the probability of getting a tails twice in a row we will first identify this outcome in the diagram.
There is only 1 way of getting a tails twice, out of the 4 possible outcomes of the experiment. Finally, we find the probability by dividing the number of favorable outcomes by the total number of outcomes. 1/4 The probability of getting tails twice when flipping a coin is 14 or 25 %.
We are asked to find the probability of getting exactly two heads when flipping a coin three times in a row. To do so we will begin by writing the sample space of the experiment. We can use a tree diagram to help us find the sample space. Let's begin by writing the different outcomes of the first throw.
Next, we write the possible outcomes of the second throw next to the outcomes of the previous throw. We will use segments to connect these throws.
We do the same for the third throw.
Finally, we write the sample space of the experiment.
The sample space consists of 8 elements. Note that we have 3 different ways of getting exactly two heads.
Lastly, we can find the probability of getting exactly two heads by dividing the number of favorable outcomes equal 3 by the number of total outcomes equal 8. 3/8