
Chapter Test
Sign In
Interpretation: See solution.
| Advertising (dollars), x | Yearly attendance, y |
|---|---|
| 500 | 400 |
| 1000 | 550 |
| 1500 | 550 |
| 2000 | 800 |
| 2500 | 650 |
| 3000 | 800 |
| 3500 | 1050 |
| 4000 | 1100 |
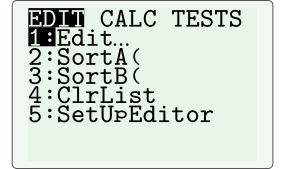
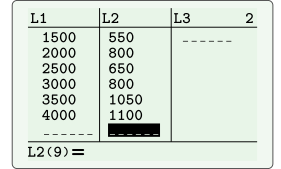
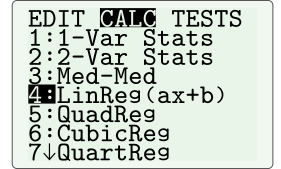
To view the linear regression analysis of the dataset we press STAT, scroll to right to view the CALC options, and then choose the fourth option in the list, LinReg(ax+b).
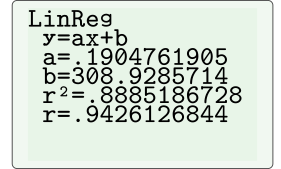
We find the equation of the line of best fit by substituting the values for a and b into the slope-intercept form equation. y= ax+ b ⇓ y= 0.19x+ 309
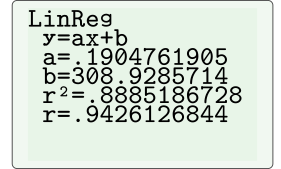
For our case, the correlation coefficient is approximately 0.94. Since it is close to 1, there is a strong correlation between the advertising and the yearly attendance.
r≈ 0.94 ⇒ Strong correlation Therefore, we should expect that the points in the scatter plot of the residuals will be close to and evenly dispersed about the horizontal axis.
|
A causal relationship exists when one variable causes a change in another variable. |
If the advertising is increased, more people learn about the festival and that will make more people visit. Therefore, there is a causal relationship between the variables.