5. Writing and Graphing Inequalities
Sign In
An error ocurred, try again later!
Chapter 6
5.
Writing and Graphing Inequalities
This educational lesson focuses on the concept of inequalities and how they can be represented both in writing and graphically. It teaches how to use a number line to visualize the solution set of an inequality. The lesson also emphasizes the importance of understanding the different types of inequalities and how they can be applied in various real-world scenarios. For example, inequalities can be used to determine the range of acceptable values for a certain variable, such as the amount of weight a bridge can hold or the speed limit on a particular road. Overall, the lesson aims to provide a thorough understanding of inequalities, making them accessible and useful in everyday life.
Show less Show more expand_more 


Lesson Settings & Tools
| | 12 Theory slides |
| | 9 Exercises - Grade E - A |
| | Each lesson is meant to take 1-2 classroom sessions |
Writing and Graphing Inequalities
Slide of 12
It is natural to compare quantities or mathematical expressions. For example, a person might compare the amount of money in their pocket to the price of a bar of chocolate. Here, the price of the chocolate can be seen as a constraint. In this lesson, real-life problems that involve constraints will be modeled by inequalities.
Catch-Up and Review
Here are a few recommended readings before getting started with this lesson.
Challenge
Share
Report error
Fishing Day With Dad
Kevin loves to go fishing with his father. They usually fish on a nearby lake. At the lake, small fishing boats are rented to groups of tourists for daily fishing trips.

For safety reasons, each boat can carry at most 600 pounds of weight. Additionally, each boat can hold a maximum of five people.
a Let w represent the total weight of a group of people wishing to rent a boat. What mathematical sentence can be written to represent all possible total weights for a boat? Draw a number line that shows solutions to the mathematical sentence.
b Let p represent the total number of people going on the boat. What mathematical sentence can be written to represent the number of people that a boat can hold? Draw a number line that shows solutions to the mathematical sentence.
Discussion
Share
Report error
Inequality
An inequality, like an equation, is a mathematical statement that compares two quantities. An inequality contains the symbols <, >, ≤, or ≥. There are several ways each inequality can be phrased.
| Inequality Symbol | Key Phrases |
|---|---|
| < | & ∙ is less than & ∙ is fewer than |
| > | & ∙ is greater than & ∙ is more than |
| ≤ | & ∙ is less than or equal to & ∙ is at most & ∙ is no more than |
| ≥ | & ∙ is greater than or equal to & ∙ is at least & ∙ is no less than |
With an inequality, it is possible to compare any combination of two numbers, variables, numeric expressions, or algebraic expressions.
| Symbol | Example | Meaning |
|---|---|---|
| < | x<1 | The variable x is less than 1. |
| ≤ | x+1 ≤ -3 | The algebraic expression x+1 is less than or equal to - 3. |
| > | 2x-5 > 5 | The expression 2x-5 is greater than 5. |
| ≥ | x ≥ 2x+1 | The variable x is greater than or equal to the expression 2x+1. |
This lesson will focus on inequalities of the following forms, where a is a number.
xDiscussion
Share
Report error
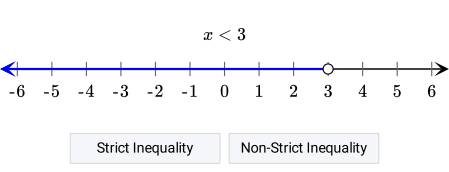
Strict and Non-Strict Inequality
An inequality that compares two quantities that are strictly not equal is called a strict inequality. There are two types of strict inequalities. Less Than:&< Greater Than:&> The boundary values in strict inequalities are not included in the solution set. On the other hand, an inequality that compares two quantities that are not necessarily different is called a non-strict inequality. There are two types of non-strict inequalities. Less Than or Equal To:&≤ Greater Than or Equal To:&≥
The boundary values in non-strict inequalities are included in the solution set.Example
Share
Report error
Fishing Time
Kevin and his father manage to find a boat so that the two of them can go fishing.

a Kevin excitedly tells his father that he wants to catch at least 7 fish. Write an inequality that represents the number of fish Kevin want to catch.
{"type":"text","form":{"type":"math","options":{"comparison":"1","nofractofloat":false,"keypad":{"simple":false,"useShortLog":false,"variables":["f"],"constants":[]},"rendered":false},"text":" "},"formTextBefore":null,"formTextAfter":null,"answer":{"text":["f \\geq 7"]}}
b Kevin's father warns Kevin about the lengths of the fish. If they catch a gray mullet, its length must be longer than 11 inches. If it is not that long, they must return the fish to the lake. Write an inequality that represents the lengths of gray mullets they are allowed to keep.
{"type":"text","form":{"type":"math","options":{"comparison":"1","nofractofloat":false,"keypad":{"simple":false,"useShortLog":false,"variables":["g"],"constants":[]},"rendered":false},"text":" "},"formTextBefore":null,"formTextAfter":null,"answer":{"text":["g > 11"]}}
Hint
a Which inequality symbol represents
at least?
b Which inequality symbol represents
more than?
Solution
a The situation can be described in one sentence as follows.
The number fish Kevin wants to catch is at least 7.
Let f be the number of fish Kevin wants to catch. The key phrase in the sentence is is at least.
This phrase represents the inequality symbol ≥. Then, the inequality can be written as follows.
The number fish Kevin wants to catch & is at least & 7. f & ≥ & 7
Therefore, the inequality is f ≥ 7.
b Like in Part A, start by describing the situation in one sentence.
The length of gray mullets must be longer than 11 inches.
Let g be the length of the gray mullet they are allowed to keep. The key phrase in this case is longer than.
This phrase can also be interpreted as more than.
It follows that the inequality symbol to use is >. Then, the inequality could be written as follows.
The length of gray mullets must be longer than 11 inches. ⇓ g > 11
The inequality is g > 11.
Discussion
Share
Report error
Solution Set of an Inequality
A solution of an inequality is any value of the variable that makes the inequality true. As an example, consider the following inequality. 2x-3< 5 Notice that if 0 is substituted for x in the inequality, the inequality holds true. Therefore, it can be said that 0 is a solution to the given inequality. 2( 0)-3 ? <5 ⇒ - 3 < 5 ✓
However, this is not the only value that makes the inequality true. There are other x-values like 1 and 2 that make it true. The set of all possible values that satisfy an inequality is the solution set of an inequality.Pop Quiz
Share
Report error
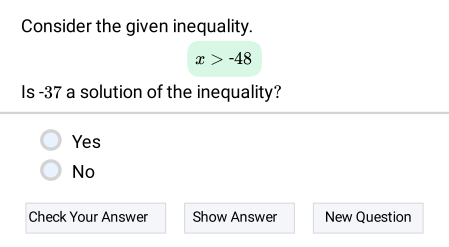
Is the Given Number a Solution of the Inequality?
The applet shows an inequality of the form x
Discussion
Share
Report error
Graphing an Inequality on a Number Line
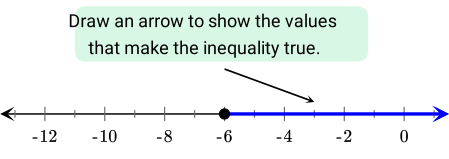
Inequalities can have an unlimited number of solutions — in other words, they might have infinitely many solutions. In such cases, number lines can be useful for showing all the values that make the inequality true. Consider graphing the solution set of the following inequality.
x ≥ - 6
The inequality is read as x is greater than or equal to - 6.
It is a non-strict inequality, so x=-6 is a solution. There are two possible cases when representing a number on a number line.
- If a number is a solution, a closed circle (∙) is used.
- If a number is not a solution, an open circle (∘) is used.
For the given inequality, a closed circle (∙) is placed at - 6 because it is a solution.
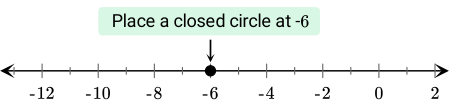
Every value of x greater than - 6 has to be included in the graph. Since greater numbers lie to the right on the number line, this is graphed as an arrow pointing to the right.
Example
Share
Report error
How Long Did It Take to Fish?
Kevin caught as many fish as he wanted in less than 5 hours.

a Write an inequality to describe the amount of time it took him to catch the fish.
b Graph the inequality on a number line.
Answer
a Inequality: t <5
b Graph:

Hint
a Which inequality symbol represents
is at least?
b Is it a strict or non-strict inequality?
Solution
a It took less than 5 hours for Kevin to catch as many fish as he wanted.
The amount of time spent fishing is less than5hours.
Let t be the amount of time that Kevin spent fishing. The key phrase in the sentence, is less than,
is represented by the symbol <. This means that the inequality can be written as follows.
The amount of time spent fishing & is less than & 5 hours. t & < & 5
The inequality t < 5 represents the situation.
b Now the number line graph for the inquality from Part A will be drawn.
t < 5
The inequality is read as t is less than 5.
This is a strict inequality, so x=5 is not a solution. Since 5 is not a solution, an open circle ∘ is used at that point.
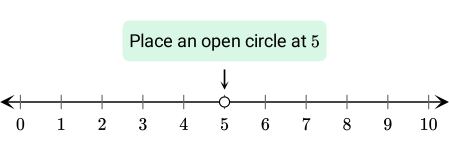
Every value of t less than 5 has to be included in the graph. Since smaller numbers lie to the left on the number line, this is graphed as an arrow pointing to the left.
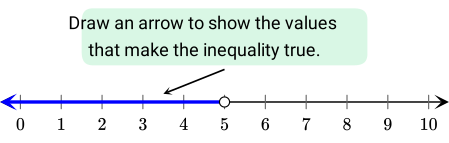
This is the graph of the inequality.
Example
Share
Report error
How Far Can Kevin Throw a Stone?
After sitting in the boat for so long, Kevin wants to go for a walk by the lake. He is curious about how far he and his father can throw stones.
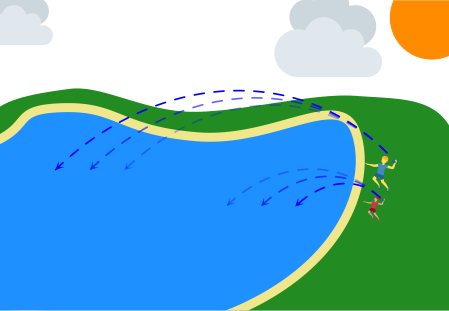
a The graph shows the distances in yards that Kevin can throw a stone. Write the inequality that the graph represents.

{"type":"text","form":{"type":"math","options":{"comparison":"1","nofractofloat":false,"keypad":{"simple":false,"useShortLog":false,"variables":["k"],"constants":[]},"rendered":false},"text":" "},"formTextBefore":null,"formTextAfter":null,"answer":{"text":["k \\leq 17","17 \\geq k"]}}
b The graph shows the distances in yards that Kevin's father can throw a stone. Write the inequality that the graph represents.

{"type":"text","form":{"type":"math","options":{"comparison":"1","nofractofloat":false,"keypad":{"simple":false,"useShortLog":false,"variables":["f"],"constants":[]},"rendered":false},"text":" "},"formTextBefore":null,"formTextAfter":null,"answer":{"text":["f < 35","35 > f"]}}
Hint
a Determine the type of circle used in the graph. Does this give any information about the inequality symbol?
b Determine the type of circle used in the graph. Does this give any information about the inequality symbol?
Solution
a Use the variable k to represent the distances that Kevin can throw a stone. Take a look at the given graph.

Notice that there is a closed circle on the graph at 17. This means that k=17 is a solution of the inequality. This also means that the graph represents a non-strict inequality.
A closed circle (∙) is used. ⇓ Inequality symbol is either ≤ or ≥.
The arrow pointing toward the left indicates that all values less than 17 are also part of the solution set. Therefore, the inequality would be k is less than or equal to 17.
This can be expressed algebraically as follows.
kis less than or equal to17. ⇓ k ≤ 17
In the context of the question, this inequality means that Kevin can throw a stone at most 17 yards.
b This time, let the variable f be the distances that Kevin's father can throw a stone. Consider the given graph.

An open circle is placed at 35, so f=35 is not a solution of the inequality. This means that the graph represents a strict inequality.
An open circle (∘) is used. ⇓ Inequality symbol is either < or >.
The arrow pointing toward the left of the line indicates that all values less than 35 are part of the solution set. Therefore, the inequality would be f is less than 35.
This can be expressed algebraically as follows.
fis less than35. ⇓ f < 35
This inequality means that Kevin's father can throw a stone no farther than 35 yards.
Pop Quiz
Share
Report error
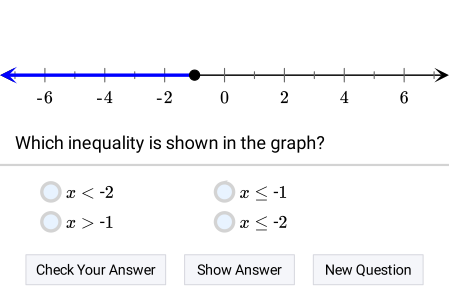
Writing an Inequality From Its Graph
Examine the given graph and determine its inequality.
Closure
Share
Report error
Father and Son Fishing Adventure
Similar to equations, inequalities are mathematical expressions. Inequalities are useful for modeling a constraint or condition in a real-world problem. Consider the situation presented at the beginning of the lesson. Boats are rented to groups of tourists on the lake where Kevin and his father go fishing.

Two facts are known about the boats. Each boat can carry up to 600 pounds and hold up to five people.
a Let w represent the total weight of a group of people wishing to rent a boat. Write and graph an inequality to represent all possible total weights for the boat.
b Let p represent the total number of people that are getting on a boat. Write and graph an inequality to represent the number of people that the boat can hold.
Answer
a Inequality: w ≤ 600
Graph:
Graph:

b Inequality: p ≤ 5
Graph:
Graph:

Hint
a Determine the inequality symbol that would mean
up to.Is the given number a solution to the inequality?
b If a number is a solution, use a closed point on the graph. If a number is not a solution, use an open point.
Solution
a The total weight of a group of people is w and each boat can carry up to 600 pounds. This means that the weight of a group that can be held in the boat is represented as the following inequality.
The total weight of a group of people is at most 600 pounds. ⇓ w ≤ 600 The inequality w ≤ 600 represents the situation. It is a non-strict inequality, so x=600 is a solution. Since 600 is a solution, use a closed circle (∙) at thsi point on the number line.
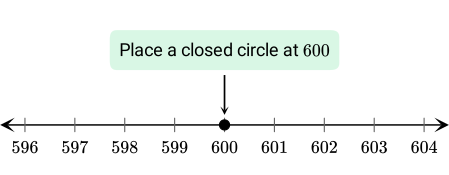
Every value of w less than 600 has to be included in the solution set on the graph. Since smaller numbers lie to the left on the number line, this is graphed as an arrow pointing to the left.
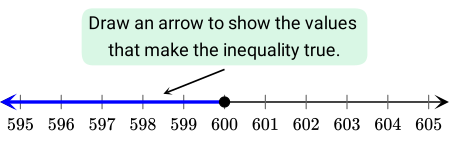
This is the graph of the inequality.
b The number of people p that can fit on each boat is at most 5 people. Then the number of people that the boat can hold is represented as the following inequality.
The number of people is at most 5. ⇓ p ≤ 5 The inequality p ≤ 5 represents this situation. This is also non-strict inequality, so x=5 is a solution. Since 5 is a solution, a closed circle (∙) is used on the graph.
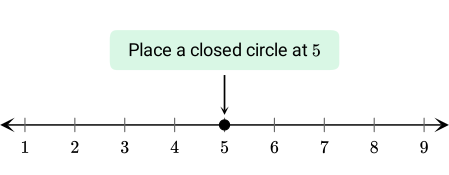
Every value of p less than 5 has to be included in the solution set. Since smaller numbers lie to the left on the number line, this is graphed as an arrow pointing to the left.
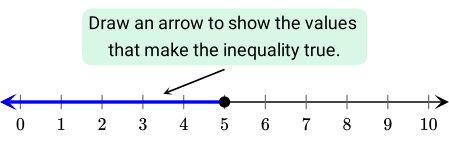
In the examples solved throughout this lesson, the variables are considered as real numbers and conditions other than those specified in the examples are ignored. For example, a negative number of people or any partial number of people would not make sense in Part B of this exercise. These constraints can be added to the solution set. p ≤ 5, wherep is a non-negative integer Now see what would happen to the graph if these additional constraints were added to the solution set.
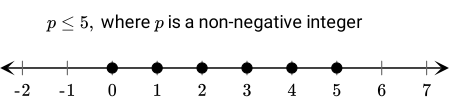
Now go through the examples again and determine in which examples negative values are meaningless or only integers make sense for the solution sets.
Writing and Graphing Inequalities
Exercise 2.1
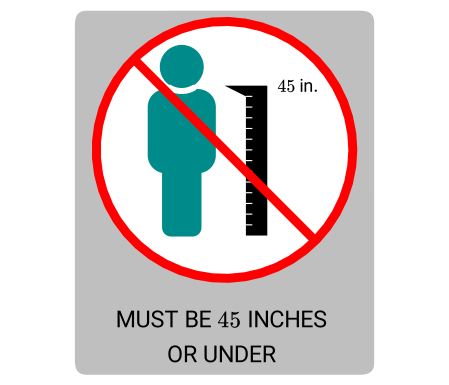
At an amusement park, kids are only allowed into the Air Bounce House if they are 45 inches tall or under.
{"type":"text","form":{"type":"math","options":{"comparison":"1","nofractofloat":false,"keypad":{"simple":false,"useShortLog":false,"variables":["h"],"constants":[]},"rendered":false},"text":" "},"formTextBefore":null,"formTextAfter":null,"answer":{"text":["h \\leq 45","45 \\geq h"]}}
security
report
code
security
report
code
Only children that are 45 inches tall or shorter are allowed in the bounce house. This means that 45 inches is the upper limit to the allowable height.
Now, let's use h to represent the height of a kid in inches. We can say that h is less than or equal to 45. h ≤ 45
security
report
code
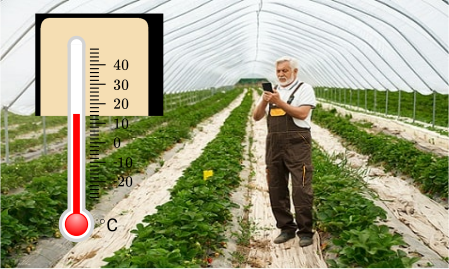
Diego's grandfather grows strawberries in his greenhouse. The temperature in the greenhouse should be 15^(∘)C or higher.
External credits: serhii_bobyk
{"type":"text","form":{"type":"math","options":{"comparison":"1","nofractofloat":false,"keypad":{"simple":false,"useShortLog":false,"variables":["t"],"constants":[]},"rendered":false},"text":" "},"formTextBefore":null,"formTextAfter":null,"answer":{"text":["t \\geq 15","15 \\leq t"]}}
security
report
code
security
report
code
Since the temperature in the greenhouse must be 15^(∘)C or higher, we can understand that 15 is the lowest allowable temperature. Temperatures greater than 15^(∘)C are also good for the development of the strawberries.
Let's use the variable t to represent the temperature. We can say that t should be greater than or equal to 15 in the greenhouse. Let's write the inequality. t ≥ 15
security
report
code
Zain has $42 to spend. They want to buy a book and another item from the list.
| Item | Price |
|---|---|
| Mug | $9 |
| Book | $18 |
| Sunglasses | $15 |
| Ball | $25 |
{"type":"text","form":{"type":"math","options":{"comparison":"1","nofractofloat":false,"keypad":{"simple":false,"useShortLog":false,"variables":["m"],"constants":[]},"rendered":false},"text":" "},"formTextBefore":null,"formTextAfter":null,"answer":{"text":["m + 18 \\leq 42","m \\leq 24","24 \\geq m","42 \\geq m + 18"]}}
{"type":"choice","form":{"alts":["Yes","No"],"noSort":true},"formTextBefore":"","formTextAfter":"","answer":1}
security
report
code
security
report
code
Let's start by finding the amount of money left after Zain buys the book. We can do this by subtracting the price of the book from the given amount of money. 42 - 18 = 24 Zian will have $24 left after buying the book. If we represent the price of the other item as m, it must be less than or equal to $24. We can represent this situation with an inequality. m ≤ 24
Alternatively, we can start by writing an expression for the sum of the prices of one book and another item. Let m be the price of the other item. This means that m+18 will be the total amount of money that Zain will pay. m + 18 This expression must be less than or equal to 42 because Zain only has $42. m + 18 ≤ 42
We know that a ball costs $25. Let's substitute this value for m into the inequality from Part A.
We can see that 25 is not a solution of the inequality, which means that Zain cannot buy a ball.
We can also use the other inequality to determine whether the other items is a ball. We substitute 25 for m again.
We got an incorrect statement, so the other item cannot be a ball.
security
report
code
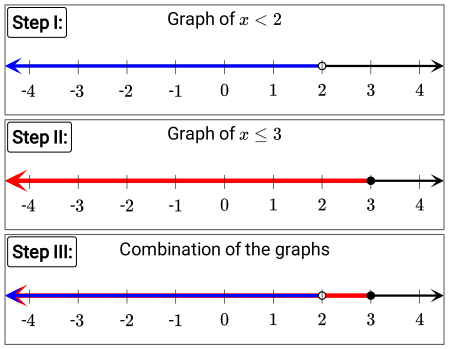
Vincenzo combines the graphs of x < 2 and x ≤ 3 on the same number line. The diagram shows the steps he followed.
{"type":"multichoice","form":{"alts":["I","II","III"],"noSort":true},"formTextBefore":"","formTextAfter":"","answer":[2]}
security
report
code
security
report
code
Let's examine the graph Vincenzo drew in Step III.
We can see that there is an open circle at 2. This means that 2 is not a solution to the inequality x < 2, even though it may be a solution to the inequality x ≤ 3. cc Inequality &Is 2 a Solution? x < 2 & * x ≤ 3 & ✓ We can conclude from this that the first statement is false. Let's move on to the second statement. Any number greater than 3 makes both inequalities false. Let's consider, for example, 3.5. cc Inequality &Is 3.5 a Solution? x < 2 & * x ≤ 3 & * Therefore, there are numbers other than 4 that make both inequalities false. Finally, the final statement is true because 0 lies on the overlapping part of the graphs, which means that 0 is a solution to both inequalities. As a result, only the third statement is correct.
security
report
code
Writing and Graphing Inequalities
Recommended exercises
To get personalized recommended exercises, please login first.
Loading content
≤
>
■2
■▢
e▢
7
8
9
×
÷■1
=
=
√▢
▢√
∫▢▢
4
5
6
+
−
≤
<
log
ln
log▢
1
2
3
()
∣
sin
cos
tan
0
.
π
x
y
Loading content