How do you find the mean of a data set? The median?
Company B has a greater mean and a greater median.
Practice makes perfect
To find which data set has a greater mean and a greater median, we will find each of these measures for each data set. Let's start with the data set of Company A.
Company A
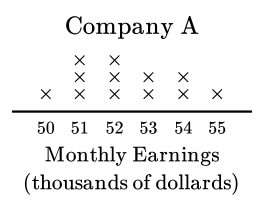
Let's look at the given graph.
To find the mean of the data set we will add each value and divide the sum by 12, because there are 12 values in the data set. Let's do it!
Now we know that the mean of the data set of Company A is 52.3. To find the median we will list every element of the data set. Then, we will identify the sixth and seventh values, since those are the values in the middle. Let's list the values.
50, 51, 51, 51, 52, 52, 52, 53, 53, 54, 54, 55
Now we can find the median by calculating the average of the middle values.
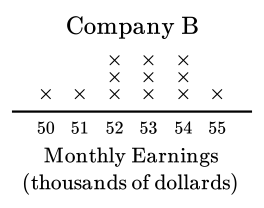
Now we know that the mean of the data set of Company B is 52.8. To find the median we will list every element of the data set. Then, we will identify the sixth and seventh values, since those are the values in the middle. Let's list the values.
50, 51, 52,52,52, 53, 53, 53, 54, 54, 54, 55
Now we can find the median by calculating the average of the middle values.
We can see that Company A has a mean of 52.3 and a median of 52. On the other side, Company B has a mean of 52.8 and a median of 53. Therefore, Company B has a greater mean and a greater median than Company A.