2. An Introduction to Periodic Functions
Sign In
An error ocurred, try again later!
Chapter 6
2.
An Introduction to Periodic Functions
This lesson delves into the intriguing world of periodic functions, focusing on their key features like amplitude and midline. It explains how these functions repeat their outputs at regular intervals, forming a definite pattern. The amplitude and midline are crucial for understanding the behavior of these functions. For instance, amplitude is half the difference between the maximum and minimum values of the function, while the midline is the average of these values. Real-life applications are also discussed, such as using periodic functions to understand heart rhythms via electrocardiograms or to study breathing patterns. Knowing these aspects can be invaluable in fields like healthcare, engineering, and even everyday problem-solving.
Show less Show more expand_more 


Lesson Settings & Tools
| | 10 Theory slides |
| | 8 Exercises - Grade E - A |
| | Each lesson is meant to take 1-2 classroom sessions |
An Introduction to Periodic Functions
Slide of 10
Sometimes patterns that repeat over time seem to emerge when using functions to model real-life situations. Knowing the properties of these functions is important to better understand their behavior. This lesson will introduce the concept of periodic function, as well as its key features.
Catch-Up and Review
Here are a few recommended readings before getting started with this lesson.
Explore
Share
Report error
Identifying Patterns in Graphs
Consider the following graphs.
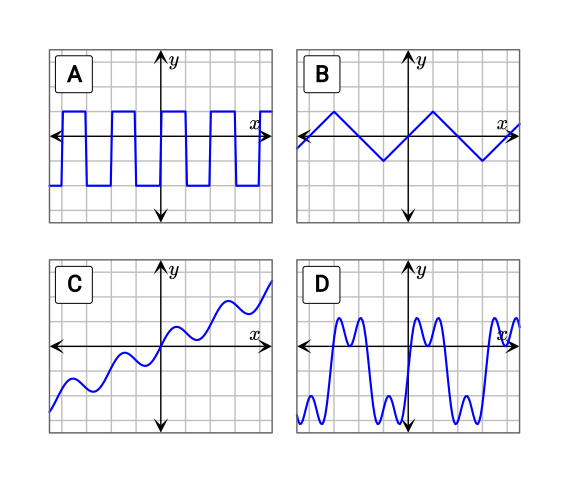
- What do these graphs have in common?
- What are their differences?
- Try determining if there is a repeating pattern in each graph.
Discussion
Share
Report error
Periodic Functions
A periodic function is a function that repeats its outputs at regular intervals, forming a definite pattern. The cycle of a periodic function is the shortest repeating portion of the graph, and the period is the horizontal length of one cycle. 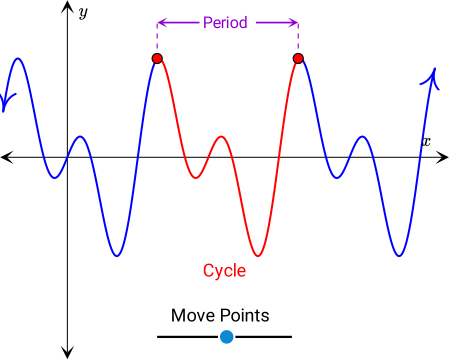 More precisely, a function f(x) is said to be periodic if a non-zero constant P exists such that f(x+P) and f(x) have the same value if and only if both x and x+P are in the domain.
f(x+P)=f(x)
Example
Share
Report error
A Visit to the Hospital
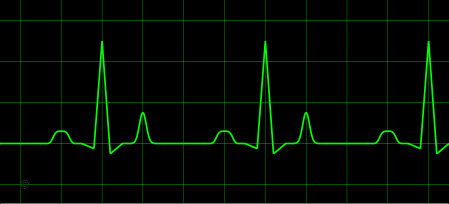
Kriz went to a hospital to with their cousin, who went there to donate blood. While waiting for their cousin, Kriz noticed that a nurse was setting up some device. They took a look at the screen and found a cool graph.
{"type":"text","form":{"type":"math","options":{"comparison":"1","nofractofloat":false,"keypad":{"simple":true,"useShortLog":false,"variables":[],"constants":[]},"rendered":false},"text":" "},"formTextBefore":null,"formTextAfter":"units","answer":{"text":["4"]}}
Hint
Identify and find the horizontal length of a cycle in the graph.
Solution
Begin by identifying a repeating portion of the graph. The peaks can be used as a reference in this case.
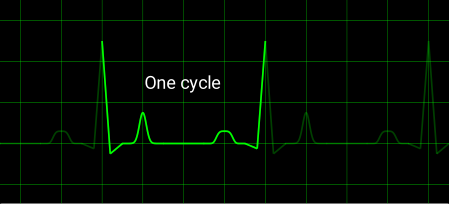
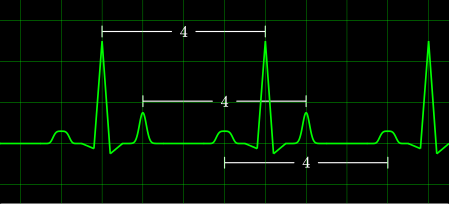
Note that any other portion of the graph could be used as well. This portion was chosen because the peaks fall on vertical gridlines and their heights stand out from the rest of the graph. Now that one cycle has been identified, the horizontal length of the cycle can be measured.
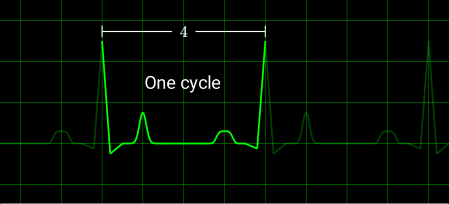
The horizontal length of the cycle is 4 units. This is the period of the function. Note that any other two points on the graph that are 4 units apart have the same y-value.
Pop Quiz
Share
Report error
Finding the Period of Periodic Functions
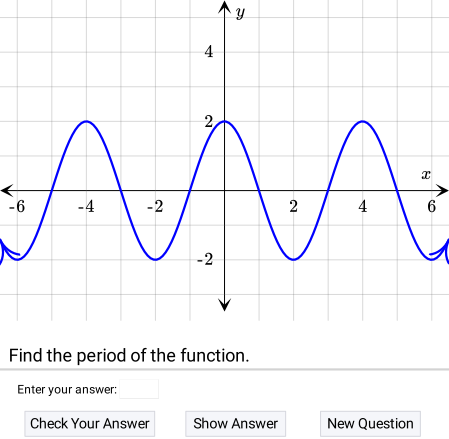
Consider the periodic function in the applet.
Example
Share
Report error
Is this a Periodic Function?
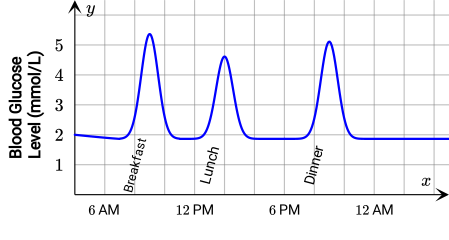
Still waiting for their cousin, Kriz picked up a pamphlet in the hospital waiting room about a diabetes awareness campaign. Kriz was interested in one particular graph in the pamphlet.
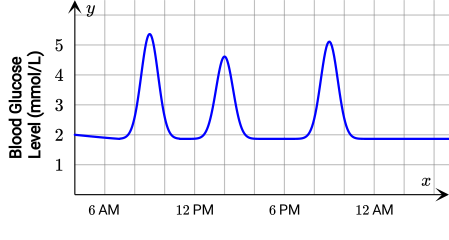
This graph represents the glucose level in blood during one day. Be aware that the graph for another day may be completely different. The pamphlet explains that a person's blood glucose level increases after every meal, and after a while it goes back down. Kriz noticed that each hump of the graph corresponds to a meal.
{"type":"choice","form":{"alts":["Yes","No"],"noSort":false},"formTextBefore":"","formTextAfter":"","answer":1}
Solution
Recall that a periodic function is a function that repeats its outputs at regular intervals, forming a distinct pattern. The humps of the graph appear to be a repeating pattern, so their heights will be inspected.
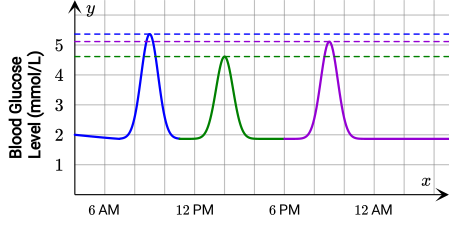
The heights of the humps are not equal, which means that the function does not repeat its outputs. Keep in mind that the graph for a different day may be completely different. Therefore, the given function is not a periodic function. This means that Kriz is not correct.
Discussion
Share
Report error
Midline and Amplitude of a Periodic Function
The main characteristic of periodic functions is their repeating behavior. For example, a periodic function alternates between its maximum and minimum values at a regular pace. For this reason, it is important to find the mean between the maximum and minimum values.
Concept
Share
Report error
Midline-Trigonometric Functions
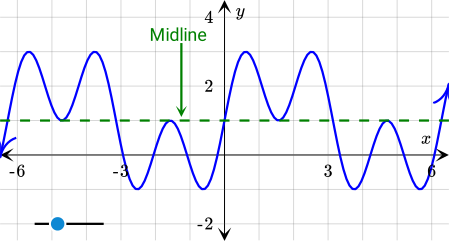
The midline of a periodic function is the horizontal line located in the middle of the minimum and maximum values.
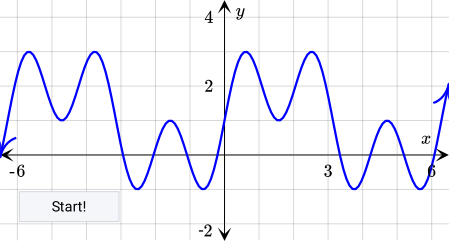 The value of the midline can be found by taking the average of the maximum and the minimum values of the function.
y_(mid) = y_(max) + y_(min)/2
Just like we can find the mean between the maximum and minimum values of a periodic function, we can also find their difference — or half their difference.
Concept
Share
Report error
Amplitude
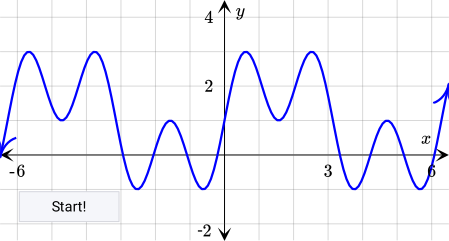
The amplitude is half the difference of the maximum and minimum values of a periodic function.
A = y_(max) - y_(min)/2
Extra
Peak-to-Peak AmplitudeThe peak-to-peak amplitude is defined as the distance between the highest value and the lowest value of a periodic function.
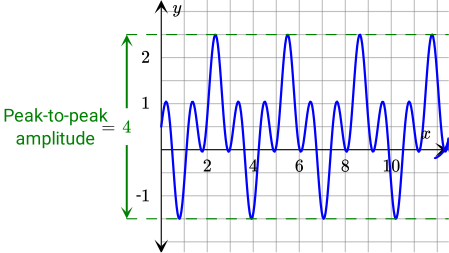
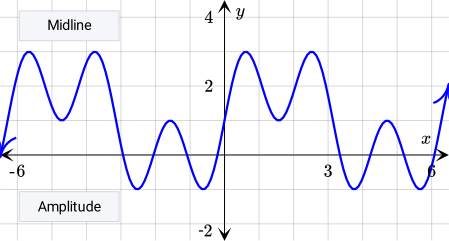
All in all, the amplitude of a periodic function is half the difference between the maximum and minimum values of the function. The midline is the horizontal line that passes right between these maximum and minimum values.
Example
Share
Report error
Inspecting the Rhythms of Breathing
Once Kriz's cousin finished donating blood, Kriz went back with the nurse to thank them for explaining the functionality of the electrocardiogram. The nurse smiled and told Kriz that they still need to wait a little more to see if Kriz's cousin would pass out due to the blood extraction.

The nurse decided to show them another device. This time it is a capnometer, which is a device used to monitor the concentration of carbon dioxide as a person breathes. The capnometer draws a capnogram.
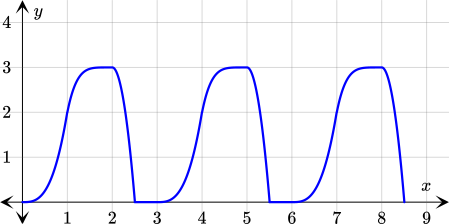
Kriz noticed how periodic functions are present even in breathing! Help Kriz study the properties of the graph shown in the capnogram.
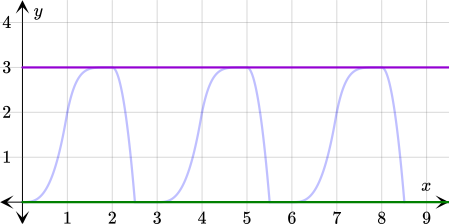
a Find the amplitude of the graph shown in the capnogram.
{"type":"text","form":{"type":"math","options":{"comparison":"1","nofractofloat":false,"keypad":{"simple":true,"useShortLog":false,"variables":[],"constants":[]},"rendered":false},"text":" "},"formTextBefore":null,"formTextAfter":null,"answer":{"text":["1.5"]}}
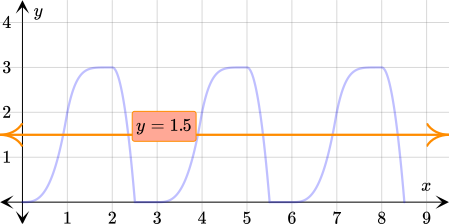
b Find the midline of the graph shown in the capnogram.
{"type":"text","form":{"type":"math","options":{"comparison":"1","nofractofloat":false,"keypad":{"simple":true,"useShortLog":false,"variables":[],"constants":[]},"rendered":false},"text":" "},"formTextBefore":"y=","formTextAfter":null,"answer":{"text":["1.5"]}}
Hint
a Use the grid to find the maximum and the minimum values of the function's graph. Use these values to calculate the amplitude.
b Use the maximum and minimum values found in Part A to calculate the midline.
Solution
a Begin by recalling the formula for the amplitude of a periodic function.
A=y_(max)-y_(min)/2 Looking at the graph, notice how the y-values all lie between 0 and 3.
b Recall the formula for the midline of a periodic function.
y_(mid)=y_(max)+y_(min)/2
SubstituteII
y_(max)= 3, y_(min)= 0
y_(mid)=3+ 0/2
IdPropAdd
Identity Property of Addition
y_(mid)=3/2
Pop Quiz
Share
Report error
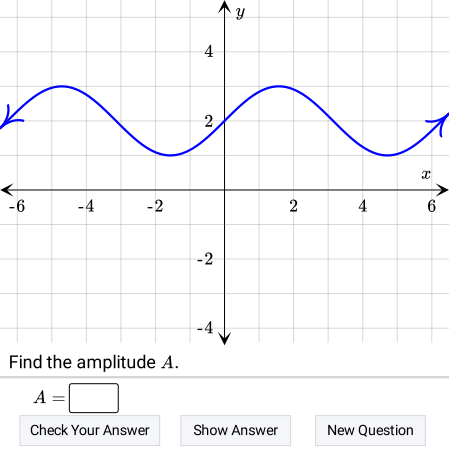
Finding the Amplitude and Midline of Periodic Functions
Consider the periodic function in the applet.
Closure
Share
Report error
The Periodicity of Trigonometric Ratios
In this lesson, the concept of a periodic function was introduced. A few real-life applications of this type of function were also presented. The main properties of periodic functions — the period, the amplitude, and the midline — were also discussed. 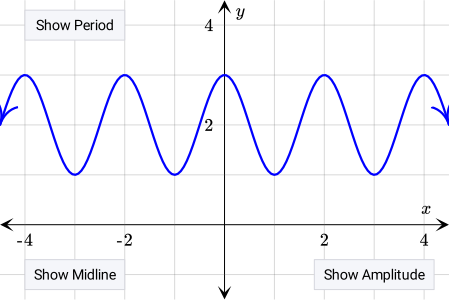 The function shown above is a special periodic function called a trigonometric function. This function takes an angle as an input and relates it to a trigonometric ratio of its corresponding reference angle. More details about this type of function will be covered in later lessons.
An Introduction to Periodic Functions
Exercises
Determine whether each of the graphs represents a periodic function.
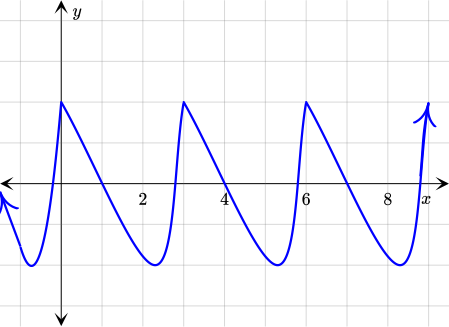
{"type":"choice","form":{"alts":["Yes","No"],"noSort":true},"formTextBefore":"","formTextAfter":"","answer":0}
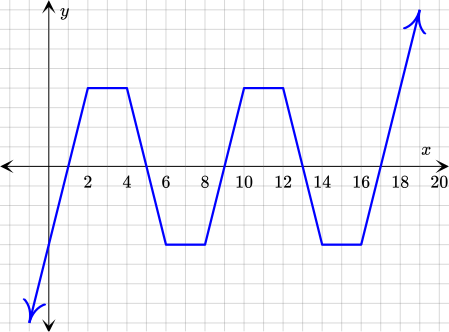
{"type":"choice","form":{"alts":["Yes","No"],"noSort":true},"formTextBefore":"","formTextAfter":"","answer":1}
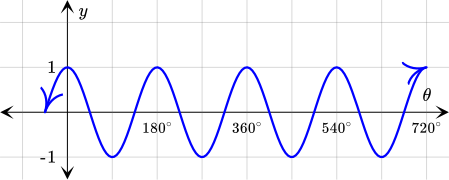
{"type":"choice","form":{"alts":["Yes","No"],"noSort":true},"formTextBefore":"","formTextAfter":"","answer":0}
security
report
code
security
report
code
We want to determine whether the given graph represents a periodic function. Recall that the outputs of a periodic function repeat at regular intervals. If the graph corresponds to a periodic function, then we can identify different cycles.
We can see that the function repeats its outputs at regular intervals, forming a definite pattern. Therefore, this graph represents a periodic function.
Again, recall that the outputs of a periodic function repeat at regular intervals. If the graph corresponds to a periodic function, then we can identify different cycles.
Here, although it may look that we have two cycles of a periodic function, we can see that the value of y tends to infinity as the value of x increases. Also, the value of y tends to negative infinity as the value of x decreases. Therefore, this graph does not represent a periodic function.
One last time, recall that the outputs of a periodic function repeat at regular intervals. If the graph corresponds to a periodic function, then we can identify different cycles.
We see that the function repeats its outputs at regular intervals, forming a definite pattern. Therefore, this graph represents a periodic function.
security
report
code
Determine the period of each periodic function.
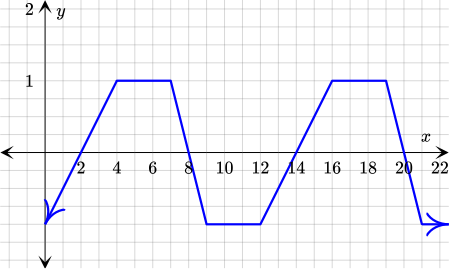
{"type":"text","form":{"type":"math","options":{"comparison":"1","nofractofloat":false,"keypad":{"simple":true,"useShortLog":false,"variables":["x"],"constants":["PI"]},"rendered":false},"text":" "},"formTextBefore":"Period:","formTextAfter":null,"answer":{"text":["12"]}}
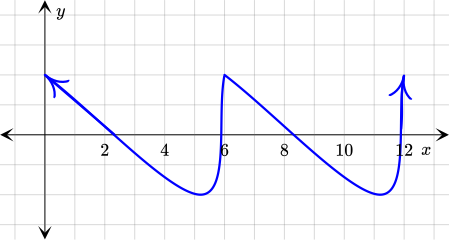
{"type":"text","form":{"type":"math","options":{"comparison":"1","nofractofloat":false,"keypad":{"simple":true,"useShortLog":false,"variables":["x"],"constants":["PI"]},"rendered":false},"text":" "},"formTextBefore":"Period:","formTextAfter":null,"answer":{"text":["6"]}}
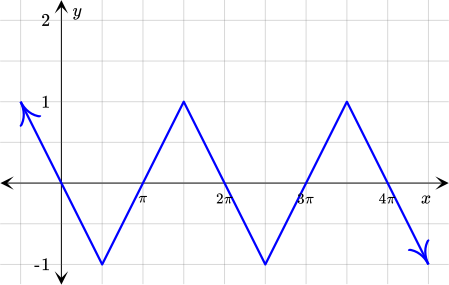
{"type":"text","form":{"type":"math","options":{"comparison":"1","nofractofloat":false,"keypad":{"simple":false,"useShortLog":false,"variables":[],"constants":["PI"]},"rendered":false},"text":" "},"formTextBefore":"Period:","formTextAfter":null,"answer":{"text":["2\\pi"]}}
security
report
code
security
report
code
We are told that the graph represents a periodic function, so we know that the y-values repeat at regular intervals. Let's first identify one cycle of the graph. Then we can find the period of the function. Recall that the period is the horizontal length of one cycle.
In this case, we have chosen a cycle that goes from 2 to 14. Since a cycle is a portion of the graph that repeats itself at regular interval, there are countless intervals we could choose, but for simplicity, the cycle we chose goes from 2 to 14. 14-2 = 12 ⇒ Period: 12
Since we know that the function is periodic, we also know that the y-values repeat at regular intervals. Let's first identify one cycle. Then we can find the period of the function.
We can see that one cycle goes from 0 to 6. A second cycle goes from 6 to 12. This is enough information to find the period. l 6-0= 6 12-6= 6 ⇒ Period: 6
Let's first identify one cycle of the given periodic function. Then we can find the period of the function.
We can see that one cycle goes from 0 to 2π, and a second cycle goes from 2π to 4π. We have enough information to find the period. l 2π-0= 2π 4π-2π= 2π ⇒ Period: 2π
security
report
code
Find the amplitude of each periodic function.
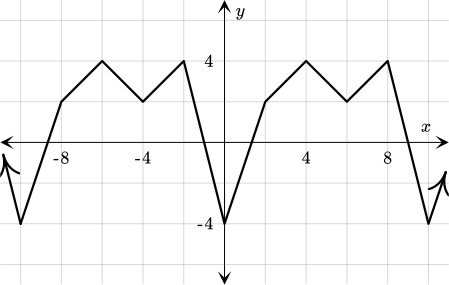
{"type":"text","form":{"type":"math","options":{"comparison":"1","nofractofloat":false,"keypad":{"simple":true,"useShortLog":false,"variables":["x"],"constants":["PI"]},"rendered":false},"text":" "},"formTextBefore":"Amplitude:","formTextAfter":null,"answer":{"text":["4"]}}
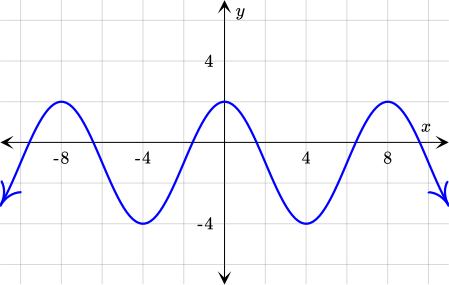
{"type":"text","form":{"type":"math","options":{"comparison":"1","nofractofloat":false,"keypad":{"simple":true,"useShortLog":false,"variables":["x"],"constants":["PI"]},"rendered":false},"text":" "},"formTextBefore":"Amplitude:","formTextAfter":null,"answer":{"text":["3"]}}
security
report
code
security
report
code
The amplitude of a periodic function is half the difference of the maximum and minimum values of the function. Amplitude: 1/2(max-min) We can see in the given graph that the maximum and minimum values of the function are 4 and - 4, respectively.
Let's use this information to find the amplitude.
The amplitude of the function is 4.
In this graph, we can see that the maximum value is 2 and that the minimum value is - 4.
We have enough information to find the amplitude. Let's do it!
The amplitude of the function is 3.
security
report
code
Find the equation of the midline of each periodic function.
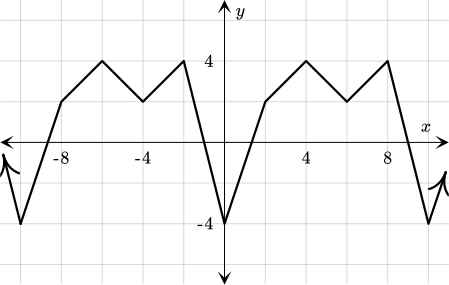
{"type":"text","form":{"type":"math","options":{"comparison":"1","nofractofloat":false,"keypad":{"simple":true,"useShortLog":false,"variables":["x"],"constants":["PI"]},"rendered":false},"text":" "},"formTextBefore":"y=","formTextAfter":null,"answer":{"text":["0"]}}
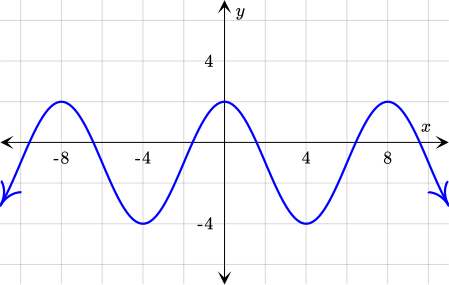
{"type":"text","form":{"type":"math","options":{"comparison":"1","nofractofloat":false,"keypad":{"simple":true,"useShortLog":false,"variables":["x"],"constants":["PI"]},"rendered":false},"text":" "},"formTextBefore":"y=","formTextAfter":null,"answer":{"text":["-1"]}}
security
report
code
security
report
code
The midline of a periodic function is the horizontal line midway between the maximum and minimum values. Midline: y=1/2(max+min) We can see in the given graph that the maximum and minimum values of the function are 4 and - 4, respectively.
We have enough information to find the equation of the midline.
The equation of the midline for this function is y=0.
In this graph, we can see that the maximum value is 2 and that the minimum value is - 4.
This is enough information to find the equation of the midline. Let's do it!
The equation of the midline for this function is y=-1.
security
report
code
An Introduction to Periodic Functions
Recommended exercises
To get personalized recommended exercises, please login first.
Loading content
≤
>
■2
■▢
e▢
7
8
9
×
÷■1
=
=
√▢
▢√
∫▢▢
4
5
6
+
−
≤
<
log
ln
log▢
1
2
3
()
∣
sin
cos
tan
0
.
π
x
y
Loading content