3. The Relationship Between Independence and Conditional Probability
Sign In
An error ocurred, try again later!
Chapter 6
3.
The Relationship Between Independence and Conditional Probability
Conditional probability and independence are two fundamental concepts in probability theory. The lesson delves into how these two are interconnected and how they differ. It uses sample space and tree diagrams as tools to explain these relationships. Understanding these concepts is crucial for anyone studying statistics, data science, or involved in decision-making processes that rely on probabilistic outcomes. The lesson serves as a comprehensive guide for both students and professionals who wish to grasp the nuances of conditional probability and independence.
Show less Show more expand_more Lesson Settings & Tools
| | 8 Theory slides |
| | 6 Exercises - Grade E - A |
| | Each lesson is meant to take 1-2 classroom sessions |
The Relationship Between Independence and Conditional Probability
Slide of 8
Sometimes, it is useful to identify the connection between different events by analyzing whether they are dependent or not. Another commonly used characteristic is a conditional probability. In this lesson, the conditional probability and its connection with independence will be discovered through the use of real-world examples.
Catch-Up and Review
Here are a few recommended readings before getting started with this lesson.
Challenge
Analyzing Connections Between Events
Vincenzo is thinking about taking a trip overseas. He is having a tough time deciding between France and Antarctica. In France he can visit the Eiffel Tower — he studies structural engineering — but Antartica has penguins and Vincenzo really loves penguins! 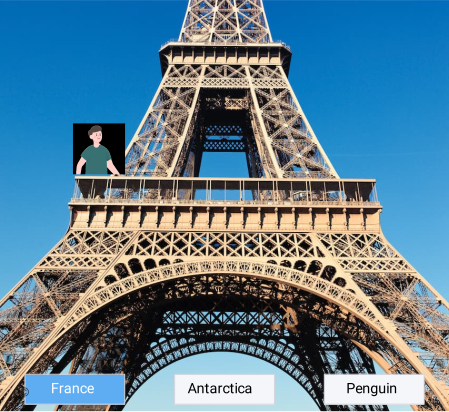 Vincenzo pulls up a search engine and types "France vs. Antartica, I wanna see penguins." He finds an interesting survey that just so happens to contrast France and Antarctica. The survey even asks specifically about penguins!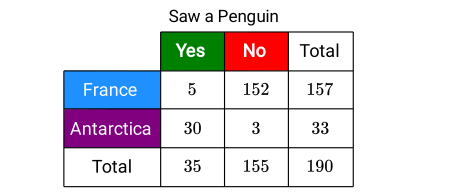
- Of 190 people surveyed, 157 people prefer going to France over Antarctica.
- Of those 157, only five people saw penguins.
- Of the people who traveled to Antarctica, only three of them did not see penguins.
The remaining results from the survey are organized in the following table.
Consider the presented data to find the probabilities of the following scenarios.
a Vincenzo decides to travel to France. What is the probability that he will see a penguin? Round the probability to the nearest percent.
{"type":"text","form":{"type":"math","options":{"comparison":"1","nofractofloat":false,"keypad":{"simple":true,"useShortLog":false,"variables":[],"constants":[]},"rendered":false},"text":"<span class=\"katex\"><span class=\"katex-html\" aria-hidden=\"true\"><\/span><\/span>"},"formTextBefore":null,"formTextAfter":"<span class=\"katex\"><span class=\"katex-html\" aria-hidden=\"true\"><span class=\"base\"><span class=\"strut\" style=\"height:0.80556em;vertical-align:-0.05556em;\"><\/span><span class=\"mspace\" style=\"margin-right:0.16666666666666666em;\"><\/span><span class=\"mord\">%<\/span><\/span><\/span><\/span>","answer":{"text":["3"]}}
b Yesterday, Vincenzo saw a penguin! What is the probability that he was in France? Round the probability to the nearest percent.
{"type":"text","form":{"type":"math","options":{"comparison":"1","nofractofloat":false,"keypad":{"simple":true,"useShortLog":false,"variables":[],"constants":[]},"rendered":false},"text":"<span class=\"katex\"><span class=\"katex-html\" aria-hidden=\"true\"><\/span><\/span>"},"formTextBefore":null,"formTextAfter":"<span class=\"katex\"><span class=\"katex-html\" aria-hidden=\"true\"><span class=\"base\"><span class=\"strut\" style=\"height:0.80556em;vertical-align:-0.05556em;\"><\/span><span class=\"mspace\" style=\"margin-right:0.16666666666666666em;\"><\/span><span class=\"mord\">%<\/span><\/span><\/span><\/span>","answer":{"text":["14"]}}
c Vincenzo’s trip just ended. Sadly, he did not see a single penguin. What is the probability that he chose to go to Antarctica? Round the probability to the nearest percent.
{"type":"text","form":{"type":"math","options":{"comparison":"1","nofractofloat":false,"keypad":{"simple":true,"useShortLog":false,"variables":[],"constants":[]},"rendered":false},"text":"<span class=\"katex\"><span class=\"katex-html\" aria-hidden=\"true\"><\/span><\/span>"},"formTextBefore":null,"formTextAfter":"<span class=\"katex\"><span class=\"katex-html\" aria-hidden=\"true\"><span class=\"base\"><span class=\"strut\" style=\"height:0.80556em;vertical-align:-0.05556em;\"><\/span><span class=\"mspace\" style=\"margin-right:0.16666666666666666em;\"><\/span><span class=\"mord\">%<\/span><\/span><\/span><\/span>","answer":{"text":["2"]}}
Example
Relationship Between Dependent Events
Diego wants to pick two books at random from a pile of five books. Three of them are Geometry books, and the other two are History books. Below, the sample space of this situation is shown, where G1, G2, G3 represent the Geometry books, and H1 and H2 represent the History books.
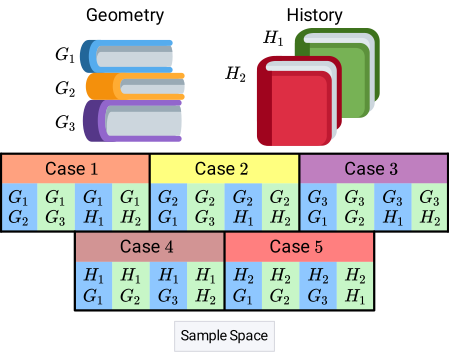 Imagine standing next to Diego and calculating the probabilities in real time with him. Let H be the event that the first book chosen is a History book, and G be the event that the second book chosen is a Geometry book. Now, consider the following scenarios.
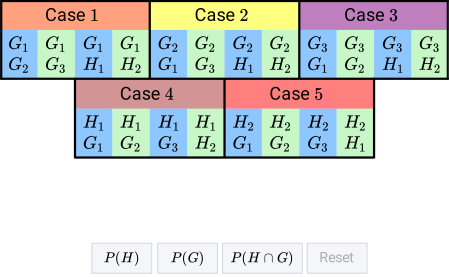 Notice that P(H∩G)=P(H)⋅P(G). That relationship implies that the given events are dependent.
Next, find the ratio of P(H∩G) to P(G).
Notice that P(H∩G)=P(H)⋅P(G). That relationship implies that the given events are dependent.
Next, find the ratio of P(H∩G) to P(G).
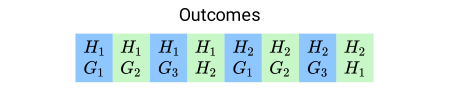 As seen, there are 8 outcomes in the new sample space and 6 of them have a Geometry book in the second position. Therefore, the probability that the second book is a Geometry book, given that the first book is a History book, can be found using the following process.
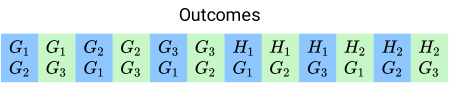 As seen, there are 12 outcomes in the new sample space and 6 of them have a History book in the first position. Therefore, the probability that the first book is a History book, given that the second book is a Geometry book can be found as follows.
a Find P(H), P(G), and P(H∩G). Express the probabilities as fractions in their simplest form.
b Find P(H)P(H∩G) and P(G)P(H∩G). Express the probabilities as fractions in their simplest form.
c If the first book Diego picked is a History book, what is the probability that the second book will be a Geometry book? Express the probability as a fraction in its simplest form.
d Diego chose both books before anyone else saw. If the second book Diego picked is a Geometry book, what is the probability that the first book he chose is a History book? Express the probability as a fraction in its simplest form.
e Is there any relationship between the probabilities found in Parts B, C, and D?
Answer
a Probabilities:
- P(H)=52
- P(G)=53
- P(H∩G)=103
b P(H)P(H∩G)=43 and P(G)P(H∩G)=21.
c 43
d 21
e Sample answer:
- The probability that event G happens given that event H happened equals P(H)P(H∩G).
- The probability that event H happens, given that event G happened equals P(G)P(H∩G).
Hint
a Every outcome that has a History book in the first position satisfies H. Similarly, every outcome that has a Geometry book in the second position satisfies G. Divide the number of favorable outcomes by the total number of outcomes.
b Divide the numbers found in Part A.
c The sample space of the given situation is not the original sample space. Start by finding the new sample space. Later, determine how many of the outcomes have a Geometry book in the second position.
d The sample space of the given situation is not the original sample space. Also, it is different from the one found in Part C. In this new sample space, count the outcomes that have a History book in the first position.
e Compare the probabilities found in Parts B, C, and D. Write a sentence stating the relationship found.
Solution
a By definition, the probability of an event is found by dividing the number of favorable outcomes by the total number of outcomes in the sample space.
P=Number of possible outcomesNumber of favorable outcomes
From the given diagram, the sample space contains 20 different outcomes. The required probabilities can be found one at a time. - To find P(H), divide the number of outcomes in the sample space with a History book in the first position by 20.
- To find P(G), divide the number of outcomes in the sample space with a Geometry book in the second position by 20.
- To find P(H∩G), divide the number of outcomes in the sample space with a History book in the first position and a Geometry book in the second position by 20.
b In this part, the probabilities found in Part A will be used.
P(H)P(G)P(H∩G)= 52= 53=103
Start by finding the ratio of P(H∩G) to P(H).
P(H)P(H∩G)
▼
Substitute values and simplify
SubstituteValues
Substitute values
52103
DivFracByFracD
c/da/b=ba⋅cd
103⋅25
MultFrac
Multiply fractions
2015
ReduceFrac
ba=b/5a/5
43
P(G)P(H∩G)
▼
Substitute values and simplify
SubstituteValues
Substitute values
53103
DivFracByFracD
c/da/b=ba⋅cd
103⋅35
MultFrac
Multiply fractions
3015
ReduceFrac
ba=b/15a/15
21
c For this situation, it is known that the first book chosen is a History book. Knowing this fact reduces the number of possible outcomes because some of the outcomes are ignored in the new situation. Therefore, the new sample space contains fewer outcomes compared to the original one.
P(G given H)=86=43
Consequently, if the first book chosen by Diego is a History book, the probability that the second book is a Geometry book is 43.
d In this case, it is known that the second book chosen is a Geometry book. This reduces the number of possible outcomes from the original sample space. Therefore, the new sample space contains fewer outcomes and it is different from the one used in Part C.
P(H given G)=126=21
Consequently, if the second book chosen by Diego is a Geometry book, the probability that the first book is a History book is 21.
e Start by writing the four probabilities found in Parts B, C, and D.
P(H)P(H∩G)P(G)P(H∩G)P(G given H)P(H given G)=43=21=43=21
Comparing the four probabilities, it can be seen that the first probability found in part B equals the probability found in part C. |
The probability that the second book is a Geometry book given that the first book chosen is a History book equals P(H)P(H∩G). |
The previous statement can also be rewritten in terms of H and G as follows.
|
The probability that event G happens given that event H happened equals P(H)P(H∩G). |
Similarly, the second probability found in part B equals the probability found in part D. This leads to write the following relation.
|
The probability that the first book is a History book, given that the second book is a Geometry book equals P(G)P(H∩G). |
As before, the previous statement can be rewritten in terms of H and G.
|
The probability that event H happens, given that event G happened equals P(G)P(H∩G). |
Example
Finding the Probability of Triggering an Alarm
At Troupial Airport, engineers are testing a prototype of a prohibited substance detector. If there is a forbidden item in a bag, an alarm is supposed to be triggered. To test the detector, 5000 bags will be checked and 7% of them will randomly contain forbidden items.
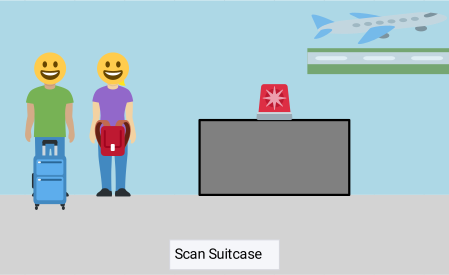 If a bag contains a forbidden item, there is a 98% chance that the alarm is triggered. On the other hand, if a bag does not have a forbidden item, there is a 4% chance that it triggers the alarm. Calculate the probabilities of the events described below. Write the probabilities as a percent rounded to two decimal places, when necessary.
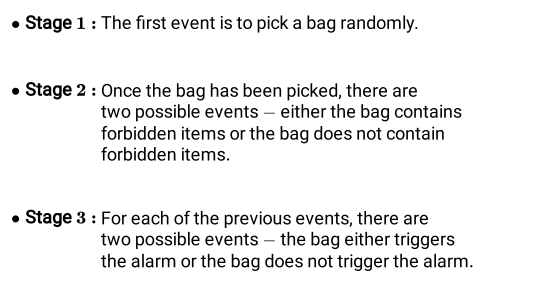 All of the previous stages and events can be illustrated using a tree diagram.
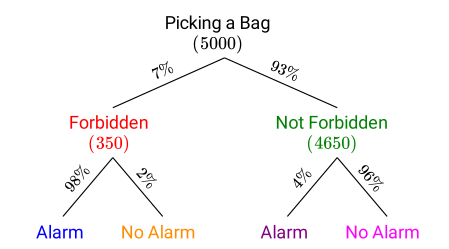
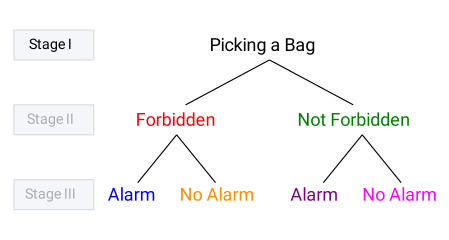 Recall that there are 5000 bags, and 7% of them contain forbidden items. The product of these numbers will give the number of the bags that contain forbidden items. The rest of the bags do not contain forbidden items.
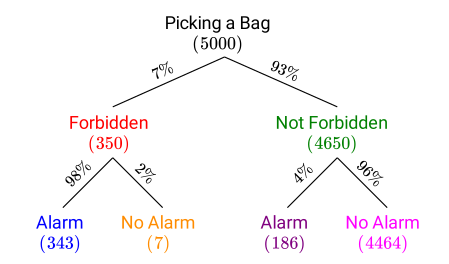 To find the probability that a bag triggers the alarm, start by finding how many bags triggered the alarm. To do so, add the two corresponding numbers in the tree diagram.
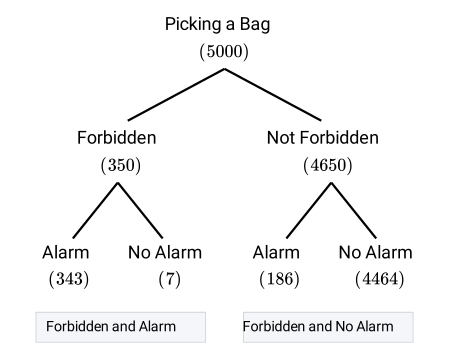 Since the total number of bags is 5000, the ratio of the number of the favorable outcomes to the total number will give the desired probability.
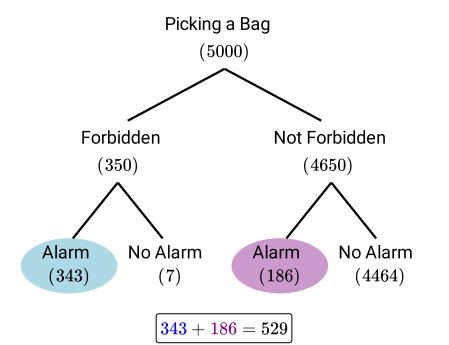 Therefore, there are 529 bags that trigger the alarm. Since Mark's bag triggered the alarm, his bag is one of those 529. Out of this group of bags, 343 had forbidden items.
Therefore, there is about a 64.84% chance that Mark's bag contains forbidden items given that his bag triggered the alarm.
Therefore, there are 529 bags that trigger the alarm. Since Mark's bag triggered the alarm, his bag is one of those 529. Out of this group of bags, 343 had forbidden items.
Therefore, there is about a 64.84% chance that Mark's bag contains forbidden items given that his bag triggered the alarm.
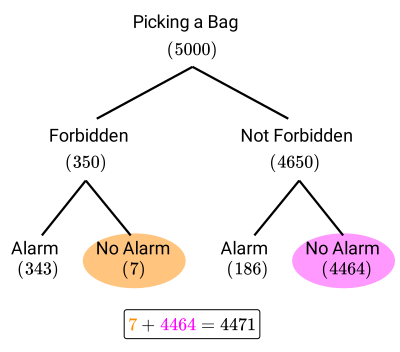 Since Izabella's bag did not trigger the alarm, her bag is one of those 4471. Out of these bags, 7 had forbidden items.
Therefore, there is about a 0.16% chance that Izabella's bag contains forbidden items given that her bag did not trigger the alarm.
Since Izabella's bag did not trigger the alarm, her bag is one of those 4471. Out of these bags, 7 had forbidden items.
Therefore, there is about a 0.16% chance that Izabella's bag contains forbidden items given that her bag did not trigger the alarm.
a Find the probability that a bag triggers the alarm.
b Find the probability that a bag triggers the alarm and contains a forbidden item. Also, find the probability that a bag does not trigger the alarm and contains a forbidden item.
c If Mark's bag triggered the alarm, what is the probability that his bag contains a forbidden item?
d If Izabella's bag did not trigger the alarm, what is the probability that her bag contains a forbidden item?
e Based on Parts C and D, what can be said about Mark and Izabella situations?
Answer
a P(Alarm)=10.58%
b P(Alarm and Forbidden)=6.86% and P(No Alarm and Forbidden)=0.14%
c The probability that Mark's bag contains a forbidden item given that it triggered the alarm is about 64.84%.
d The probability that Izabella's bag contains a forbidden item given that it did not trigger the alarm is about 0.16%.
e Example Solution:
- There is a 64.84% chance that Mark's bag contains a forbidden item. However, this probability is not big enough to ensure Mark has a forbidden item. Therefore, it is doubtful — but possible — that Mark contains a forbidden item in his bag.
- There is a 0.16% chance that Izabella's bag contains a forbidden item. Since this probability is very small — less than 1% — it is almost certain that Izabella does not have forbidden items in her bag — but still possible.
Hint
a Make a tree diagram and write the number of bags corresponding to every node. The probability of triggering the alarm is the total number of bags that triggered the alarm divided by the total amount of bags checked.
b Determine how many bags contain a forbidden item and trigger the alarm. Divide this number by the total number of bags checked. Similar reasoning can be used for the case where the bags do not trigger the alarm.
c Considering the diagram drawn in Part A, what is the total number of bags that trigger the alarm? Of all these bags, how many actually had forbidden items?
d Of all the bags that did not trigger the alarm, how many had forbidden items? Divide this last number by the total number of bags that did not trigger the alarm.
e If the probability of an event is closer to 50% than 100%, then it is doubtful that the event actually happened. If the probability of an event is close to 0%, it is almost certain that the event did not happen.
Solution
a To find the probability that a bag triggers the alarm, a tree diagram will be drawn. To do so, first notice that the situation can be divided into three different stages.
Forbidden:Not Forbidden:5000 ⋅ 7%=3505000−350=4650
Additionally, the following two details about the bags are known. - If a bag contains forbidden items, there is a 98% chance that it triggers the alarm.
- If a bag does not have forbidden items, there is a 4% chance that it triggers the alarm.
Considering these details, it can be concluded that 2% of the bags containing forbidden items could trigger the alarm and 96% of the bags that do not have forbidden items could not trigger the alarm.
Now, using the percentages in the branches, the number of bags for each event can be found.
| Forbidden and Alarm | 350⋅98%=343 |
|---|---|
| Forbidden and No Alarm | 350⋅2%=7 |
| Not Forbidden and Alarm | 4650⋅4%=186 |
| Not Forbidden and No Alarm | 4650⋅96%=4464 |
Finally, all the information can be shown on the tree diagram.
Bags that triggered the alarm: 343+186=529
The probability that a randomly picked bag triggers the alarm P(Alarm) is obtained dividing 529 by the total number of bags.
P(Alarm)=5000529
CalcQuot
Calculate quotient
P(Alarm)=0.1058
WritePercent
Convert to percent
P(Alarm)=10.58%
b Pulling information from the tree diagram, it is seen that the number of bags that triggered the alarm and had forbidden items is 343 and the number of bags that contained forbidden items and did not trigger the alarm is 7.
| Probabilities of the Events | ||
|---|---|---|
| P(Alarm and Forbidden) | 5000343=6.86% | |
| P(No Alarm and Forbidden) | 50007=0.14% | |
Take note that the sum of the probabilities is equal to 7%, which is the percentage of the bags that contain forbidden items.
c To determine the probability that a bag contains forbidden items — given that it triggered the alarm — divide the total number of bags that both triggered the alarm and had forbidden items by the total number of bags that triggered the alarm.
P=AlarmAlarm and Forbidden
As presented in the tree diagram, the number of bags that trigger the alarm is equal to the sum of the numbers under the word Alarm.
P=529343
▼
Evaluate right-hand side
CalcQuot
Calculate quotient
P=0.648393…
RoundDec
Round to 4 decimal place(s)
P≈0.6484
WritePercent
Convert to percent
P≈64.84%
d To determine the probability that a bag contains forbidden items given that it did not trigger the alarm, divide the total number of bags that did not trigger the alarm and had forbidden items by the total number of bags that did not trigger the alarm.
P=No AlarmNo Alarm and Forbidden
First, find the number of bags did not trigger the alarm. P=44717
▼
Evaluate right-hand side
CalcQuot
Calculate quotient
P=0.001565…
RoundDec
Round to 4 decimal place(s)
P≈0.0016
WritePercent
Convert to percent
P≈0.16%
e If the probability of an event is closer to 50% than 100%, then it is doubtful that the event would actually happen. With that in mind, consider the probability found in Part C.
|
There is about a 64.84% chance that Mark's bag contains a forbidden item. |
This probability is not close enough to 100% to ensure that Mark's bag contains a forbidden item. Therefore, it is doubtful — but possible — that Mark's bag contains a forbidden item. Next, recall the answer found in Part D.
|
There is about a 0.16% chance that Izabella's bag contains a forbidden item. |
Since this probability is very small — less than 1% — it is almost certain that Izabella does not have forbidden items in her bag — but still possible.
Discussion
Conditional Probability
Conditional probability is the measure of the likelihood of an event B occurring, given that event A has occurred previously. The probability of B given A is written as P(B∣A). It can be calculated by dividing the probability of the intersection of A and B by the probability of A.
P(B∣A)=P(A)P(A and B),where P(A)=0
P(B∣A)=P(A∣B)
Why
Intuition Behind the FormulaThe intuition behind the formula can be visualized by using Venn Diagrams. Consider a sample space S and the events A and B such that P(A)=0.
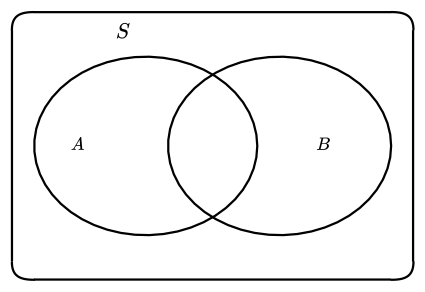
Assuming that event A has occurred, the sample space is reduced to A.
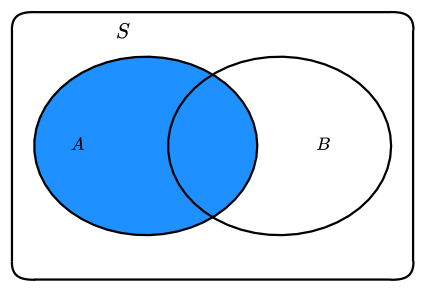
This means that the probability that event B can happen is reduced to the outcomes in the intersection of A and B, that is, to those outcomes in A∩B.
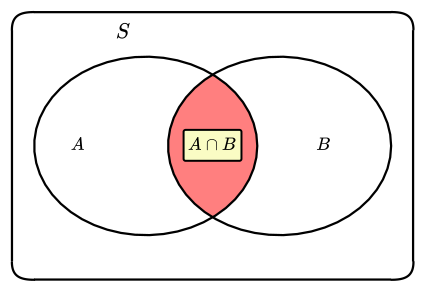
The possible outcomes are given by P(A) and the favorable outcomes by P(A∩B). Therefore, the conditional probability formula can be obtained using the probability formula.
P(B∣A)=P(A)P(A and B)
Example
Probability of Getting the Correct Size and Color
Diego's generous father has finished doing laundry and put Diego's T-shirts along with those of his big brother into the same ol’ basket. There are orange, blue, and red T-shirts in the basket, of which four are S-sized and eight are M-sized.
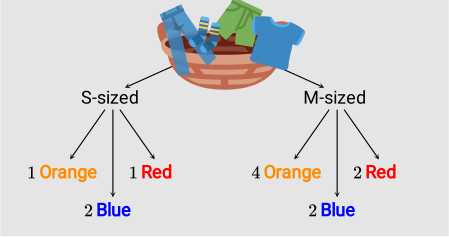
Event S:Event O:Event B: Diego picks an S-sized T-shirt. Diego picks an orange T-shirt. Diego picks a blue T-shirt.
a Find and compare P(S∣O) and P(O∣S). Write the answers as fractions in their simplest form.
{"type":"text","form":{"type":"math","options":{"comparison":"1","nofractofloat":false,"keypad":{"simple":true,"useShortLog":false,"variables":[],"constants":[]},"rendered":false},"text":"<span class=\"katex\"><span class=\"katex-html\" aria-hidden=\"true\"><\/span><\/span>"},"formTextBefore":"<span class=\"katex\"><span class=\"katex-html\" aria-hidden=\"true\"><span class=\"base\"><span class=\"strut\" style=\"height:1em;vertical-align:-0.25em;\"><\/span><span class=\"mord mathdefault\" style=\"margin-right:0.13889em;\">P<\/span><span class=\"mopen\">(<\/span><span class=\"mord mathdefault\" style=\"margin-right:0.05764em;\">S<\/span><span class=\"mord\">\u2223<\/span><span class=\"mord mathdefault\" style=\"margin-right:0.02778em;\">O<\/span><span class=\"mclose\">)<\/span><span class=\"mspace\" style=\"margin-right:0.2777777777777778em;\"><\/span><span class=\"mrel\">=<\/span><\/span><\/span><\/span>","formTextAfter":null,"answer":{"text":["1\/5","\\dfrac{1}{5}"]}}
{"type":"text","form":{"type":"math","options":{"comparison":"1","nofractofloat":false,"keypad":{"simple":true,"useShortLog":false,"variables":[],"constants":[]},"rendered":false},"text":"<span class=\"katex\"><span class=\"katex-html\" aria-hidden=\"true\"><\/span><\/span>"},"formTextBefore":"<span class=\"katex\"><span class=\"katex-html\" aria-hidden=\"true\"><span class=\"base\"><span class=\"strut\" style=\"height:1em;vertical-align:-0.25em;\"><\/span><span class=\"mord mathdefault\" style=\"margin-right:0.13889em;\">P<\/span><span class=\"mopen\">(<\/span><span class=\"mord mathdefault\" style=\"margin-right:0.02778em;\">O<\/span><span class=\"mord\">\u2223<\/span><span class=\"mord mathdefault\" style=\"margin-right:0.05764em;\">S<\/span><span class=\"mclose\">)<\/span><span class=\"mspace\" style=\"margin-right:0.2777777777777778em;\"><\/span><span class=\"mrel\">=<\/span><\/span><\/span><\/span>","formTextAfter":null,"answer":{"text":["1\/4","\\dfrac{1}{4}"]}}
b Find and compare P(S∣B) and P(B∣S). Write the answers as fractions in their simplest form.
{"type":"text","form":{"type":"math","options":{"comparison":"1","nofractofloat":false,"keypad":{"simple":true,"useShortLog":false,"variables":[],"constants":[]},"rendered":false},"text":"<span class=\"katex\"><span class=\"katex-html\" aria-hidden=\"true\"><\/span><\/span>"},"formTextBefore":"<span class=\"katex\"><span class=\"katex-html\" aria-hidden=\"true\"><span class=\"base\"><span class=\"strut\" style=\"height:1em;vertical-align:-0.25em;\"><\/span><span class=\"mord mathdefault\" style=\"margin-right:0.13889em;\">P<\/span><span class=\"mopen\">(<\/span><span class=\"mord mathdefault\" style=\"margin-right:0.05764em;\">S<\/span><span class=\"mord\">\u2223<\/span><span class=\"mord mathdefault\" style=\"margin-right:0.05017em;\">B<\/span><span class=\"mclose\">)<\/span><span class=\"mspace\" style=\"margin-right:0.2777777777777778em;\"><\/span><span class=\"mrel\">=<\/span><\/span><\/span><\/span>","formTextAfter":null,"answer":{"text":["1\/2","\\dfrac{1}{2}"]}}
{"type":"text","form":{"type":"math","options":{"comparison":"1","nofractofloat":false,"keypad":{"simple":true,"useShortLog":false,"variables":[],"constants":[]},"rendered":false},"text":"<span class=\"katex\"><span class=\"katex-html\" aria-hidden=\"true\"><\/span><\/span>"},"formTextBefore":"<span class=\"katex\"><span class=\"katex-html\" aria-hidden=\"true\"><span class=\"base\"><span class=\"strut\" style=\"height:1em;vertical-align:-0.25em;\"><\/span><span class=\"mord mathdefault\" style=\"margin-right:0.13889em;\">P<\/span><span class=\"mopen\">(<\/span><span class=\"mord mathdefault\" style=\"margin-right:0.05017em;\">B<\/span><span class=\"mord\">\u2223<\/span><span class=\"mord mathdefault\" style=\"margin-right:0.05764em;\">S<\/span><span class=\"mclose\">)<\/span><span class=\"mspace\" style=\"margin-right:0.2777777777777778em;\"><\/span><span class=\"mrel\">=<\/span><\/span><\/span><\/span>","formTextAfter":null,"answer":{"text":["1\/2","\\dfrac{1}{2}"]}}
Hint
a Start by finding P(O), P(S), and P(S and O). Then, apply the formula for finding the conditional probability.
b Find P(B) and P(S and B). From Part A, P(S) is already known. Apply the formula for finding conditional probability again.
Solution
a To start, remember the formula for finding the conditional probability that event B happens given that event A has occurred.
P(B∣A)=P(A)P(A and B)
Applying this formula, the required probabilities can be rewritten as follows.
P(S∣O)P(O∣S)=P(O)P(S and O)=P(S)P(S and O)
Consequently, P(S and O), P(O), and P(S) need to be found. To do so, start by writing the formula to find the probability of an event.
P=Number of possible outcomesNumber of favorable outcomes
Notice that P(S and O) represents the probability of picking an S-size orange T-shirt. From the diagram, there are 12 T-shirts in the basket, and there is only one S-size orange T-shirt.
P(S and O)=121✓
To find P(O), count how many of the 12 T-shirts are orange. From the diagram, there are only 5.
P(O)=125✓
To determine P(S), count how many of the 12 T-shirts are S-sized. From the diagram, there are only 4.
P(S)=124=31✓
Finding Conditional Probabilities
To find P(S∣O), divide P(S and O)=121 by P(O)=125.P(S∣O)=P(O)P(S and O)
▼
Substitute values and simplify
SubstituteII
P(S and O)=121, P(O)=125
P(S∣O)=125121
DivFracByFracD
c/da/b=ba⋅cd
P(S∣O)=121⋅512
MultFrac
Multiply fractions
P(S∣O)=6012
ReduceFrac
ba=b/12a/12
P(S∣O)=51
P(O∣S)=P(S)P(S and O)
▼
Substitute values and simplify
SubstituteII
P(S and O)=121, P(S)=31
P(O∣S)=31121
DivFracByFracD
c/da/b=ba⋅cd
P(O∣S)=121⋅13
MultFrac
Multiply fractions
P(O∣S)=123
ReduceFrac
ba=b/3a/3
P(O∣S)=41
b Similar to the previous part, start by applying the conditional probability formula to rewrite the given expressions.
P(S∣B)P(B∣S)=P(B)P(S and B)=P(S)P(S and B)
From Part A, it is known that P(S) equals 31. Thus, only P(S and B) and P(B) are missing. Note that P(S and B) is the probability of picking an S-size blue T-shirt. From the 12 T-shirts, only two are blue and S-sized.
P(S and B)=122=61✓
To determine P(B), count how many of the 12 T-shirts are blue. From the diagram, there are 4.
P(B)=124=31✓
Finding Conditional Probabilities
Substituting the found probabilities into the initial equations, the required probabilities will be obtained. Start by finding P(S∣B).P(S∣B)=P(B)P(S and B)
▼
Substitute values and simplify
SubstituteII
P(S and B)=61, P(B)=31
P(S∣B)=3161
DivFracByFracD
c/da/b=ba⋅cd
P(S∣B)=61⋅13
MultFrac
Multiply fractions
P(S∣B)=63
ReduceFrac
ba=b/3a/3
P(S∣B)=21
P(B∣S)=P(S)P(S and B)
▼
Substitute values and simplify
SubstituteII
P(S and B)=61, P(S)=31
P(B∣S)=3161
DivFracByFracD
c/da/b=ba⋅cd
P(B∣S)=61⋅13
MultFrac
Multiply fractions
P(B∣S)=63
ReduceFrac
ba=b/3a/3
P(B∣S)=21
Pop Quiz
Applying the Conditional Probability Formula
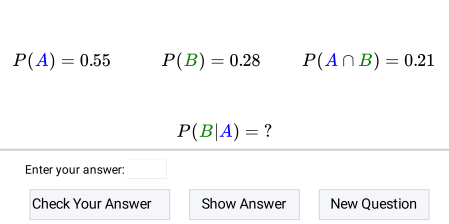
Find the required conditional probability and round it to two decimal places.
Closure
Destinations, Penguins, and Probabilities
Now that it is known how to compute conditional probabilities, Vincenzo's situation can be better investigated.
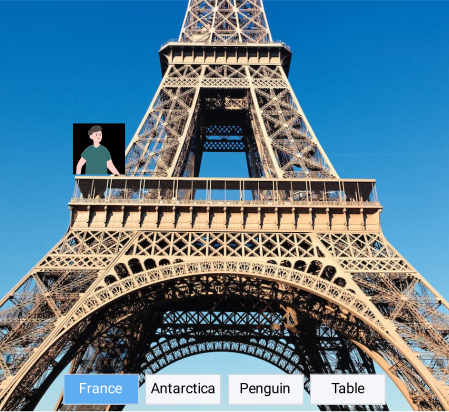

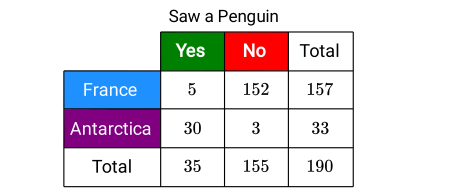 A total 190 people participated in the survey and 5 of them traveled to France and saw a penguin.
Consequently, Vincenzo has about a 3% chance of seeing penguins, given that he traveled to France.
A total 190 people participated in the survey and 5 of them traveled to France and saw a penguin.
Consequently, Vincenzo has about a 3% chance of seeing penguins, given that he traveled to France.
 From Part A, the numerator is equal to 381. To determine the probability of seeing penguins, determine how many of the 190 people surveyed actually saw penguins. According to the table, 35 people answered that they did.
In conclusion, there is about a 14% chance that Vincenzo was in France, given that he saw penguins.
From Part A, the numerator is equal to 381. To determine the probability of seeing penguins, determine how many of the 190 people surveyed actually saw penguins. According to the table, 35 people answered that they did.
In conclusion, there is about a 14% chance that Vincenzo was in France, given that he saw penguins.
 From the second row and second column of the table, 3 of the 190 people traveled to Antarctica and did not see penguins.
Consequently, there is about a 2% chance that Vincenzo chose to go to Antarctica, given that he did not see penguins.
From the second row and second column of the table, 3 of the 190 people traveled to Antarctica and did not see penguins.
Consequently, there is about a 2% chance that Vincenzo chose to go to Antarctica, given that he did not see penguins.
a Vincenzo decides to travel to France. What is the probability he will see a penguin? Round the probability to the nearest percent.
{"type":"text","form":{"type":"math","options":{"comparison":"1","nofractofloat":false,"keypad":{"simple":true,"useShortLog":false,"variables":[],"constants":[]},"rendered":false},"text":"<span class=\"katex\"><span class=\"katex-html\" aria-hidden=\"true\"><\/span><\/span>"},"formTextBefore":null,"formTextAfter":"<span class=\"katex\"><span class=\"katex-html\" aria-hidden=\"true\"><span class=\"base\"><span class=\"strut\" style=\"height:0.80556em;vertical-align:-0.05556em;\"><\/span><span class=\"mspace\" style=\"margin-right:0.16666666666666666em;\"><\/span><span class=\"mord\">%<\/span><\/span><\/span><\/span>","answer":{"text":["3"]}}
b Yesterday, Vincenzo saw a penguin! What is the probability that he was in France? Round the probability to the nearest percent.
{"type":"text","form":{"type":"math","options":{"comparison":"1","nofractofloat":false,"keypad":{"simple":true,"useShortLog":false,"variables":[],"constants":[]},"rendered":false},"text":"<span class=\"katex\"><span class=\"katex-html\" aria-hidden=\"true\"><\/span><\/span>"},"formTextBefore":null,"formTextAfter":"<span class=\"katex\"><span class=\"katex-html\" aria-hidden=\"true\"><span class=\"base\"><span class=\"strut\" style=\"height:0.80556em;vertical-align:-0.05556em;\"><\/span><span class=\"mspace\" style=\"margin-right:0.16666666666666666em;\"><\/span><span class=\"mord\">%<\/span><\/span><\/span><\/span>","answer":{"text":["14"]}}
c Vincenzo’s trip just ended. Sadly, he did not see a single penguin. What is the probability that he chose to go to Antarctica? Round the probability to the nearest percent.
{"type":"text","form":{"type":"math","options":{"comparison":"1","nofractofloat":false,"keypad":{"simple":true,"useShortLog":false,"variables":[],"constants":[]},"rendered":false},"text":"<span class=\"katex\"><span class=\"katex-html\" aria-hidden=\"true\"><\/span><\/span>"},"formTextBefore":null,"formTextAfter":"<span class=\"katex\"><span class=\"katex-html\" aria-hidden=\"true\"><span class=\"base\"><span class=\"strut\" style=\"height:0.80556em;vertical-align:-0.05556em;\"><\/span><span class=\"mspace\" style=\"margin-right:0.16666666666666666em;\"><\/span><span class=\"mord\">%<\/span><\/span><\/span><\/span>","answer":{"text":["2"]}}
Hint
a Use the formula of conditional probability. Gathering the data from the table, a total of 190 people participated in the survey. Of that total 5, traveled to France and saw penguins.
b A total of 35 people saw penguins. How many of these were in France?
c Of the 190 people, 155 did not see penguins and 3 of them traveled to Antarctica.
Solution
a By the definition of conditional probability, the probability that Vincenzo saw a penguin given that he traveled to France can be expressed in the following manner.
To find the corresponding probabilities, take a look at the table.
P(Penguin and France)=1905=381
Additionally, 157 people traveled to France.
P(France)=190157
Next, substitute these two probabilities into the conditional probability formula.
P(Penguin∣France)=P(France)P(Penguin and France)
▼
Substitute values and simplify
SubstituteII
P(Penguin and France)=381, P(France)=190157
P(Penguin∣France)=190157381
DivFracByFracD
c/da/b=ba⋅cd
P(Penguin∣France)=381⋅157190
MultFrac
Multiply fractions
P(Penguin∣France)=5966190
CalcQuot
Calculate quotient
P(Penguin∣France)=0.031847…
WritePercent
Convert to percent
P(Penguin∣France)=3.1847…%
RoundInt
Round to nearest integer
P(Penguin∣France)≈3%
b In this case, the situation is opposite to that presented in Part A. Now, it is known that Vincenzo saw penguins, and it is asked to find the probability that Vincenzo is in France. As before, start by applying the conditional probability formula.
P(Penguins)=19035=387
The next step is to substitute the two probabilities found into the conditional probability formula.
P(France∣Penguin)=P(Penguins)P(Penguin and France)
▼
Substitute values and simplify
SubstituteII
P(Penguin and France)=381, P(Penguins)=387
P(France∣Penguin)=387381
DivFracByFracD
c/da/b=ba⋅cd
P(France∣Penguin)=381⋅738
MultFrac
Multiply fractions
P(France∣Penguin)=26638
CalcQuot
Calculate quotient
P(France∣Penguin)=0.142857…
WritePercent
Convert to percent
P(France∣Penguin)=14.2857…%
RoundInt
Round to nearest integer
P(France∣Penguin)≈14%
c Once more, start by applying the conditional probability formula.
P(Antarctica and No Penguin)=1903
Seen in the third row of the table, 155 people did not see penguins. Knowing this, the probability that a person picked at random did not see penguins can be computed.
P(No Penguin)=190155=3831
Finally, substitute these values into the conditional probability formula.
P(Antarctica∣No Penguin)=P(No Penguin)P(Antarctica and No Penguin)
▼
Substitute values and simplify
SubstituteII
P(Antarctica and No Penguin)=1903, P(No Penguin)=3831
P(Antarctica∣No Penguin)=38311903
DivFracByFracD
c/da/b=ba⋅cd
P(Antarctica∣No Penguin)=1903⋅3138
MultFrac
Multiply fractions
P(Antarctica∣No Penguin)=5890114
CalcQuot
Calculate quotient
P(Antarctica∣No Penguin)=0.019354…
WritePercent
Convert to percent
P(Antarctica∣No Penguin)=19.354…%
RoundInt
Round to nearest integer
P(Antarctica∣No Penguin)≈2%
The Relationship Between Independence and Conditional Probability
Exercises
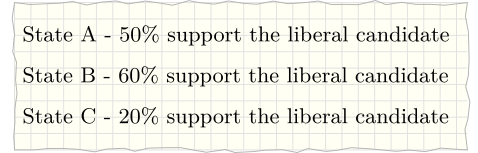
Suppose a voter poll is conducted in three states. The following information is recorded.
{"type":"text","form":{"type":"math","options":{"comparison":"1","nofractofloat":false,"keypad":{"simple":true,"useShortLog":false,"variables":["x"],"constants":["PI"]},"rendered":false},"text":"<span class=\"katex\"><span class=\"katex-html\" aria-hidden=\"true\"><\/span><\/span>"},"formTextBefore":"<span class=\"katex\"><span class=\"katex-html\" aria-hidden=\"true\"><span class=\"base\"><span class=\"strut\" style=\"height:1em;vertical-align:-0.25em;\"><\/span><span class=\"mord mathdefault\" style=\"margin-right:0.13889em;\">P<\/span><span class=\"mopen\">(<\/span><span class=\"mord text\"><span class=\"mord Roboto-Regular\">state<\/span><span class=\"mord\">\u00a0<\/span><span class=\"mord Roboto-Regular\">B<\/span><\/span><span class=\"mord\">\u2223<\/span><span class=\"mord text\"><span class=\"mord Roboto-Regular\">liberal<\/span><span class=\"mord\">\u00a0<\/span><span class=\"mord Roboto-Regular\">voter<\/span><\/span><span class=\"mclose\">)<\/span><span class=\"mspace\" style=\"margin-right:0.2777777777777778em;\"><\/span><span class=\"mrel\">\u2248<\/span><\/span><\/span><\/span>","formTextAfter":"<span class=\"katex\"><span class=\"katex-html\" aria-hidden=\"true\"><span class=\"base\"><span class=\"strut\" style=\"height:0.80556em;vertical-align:-0.05556em;\"><\/span><span class=\"mspace\" style=\"margin-right:0.16666666666666666em;\"><\/span><span class=\"mord\">%<\/span><\/span><\/span><\/span>","answer":{"text":["36"]}}
security
report
code
security
report
code
Let's start by illustrating the information about the number of people living in the three states. Of 100 % of the voters, 40 % live in State A, 25 % live in State B, and 35 % live in State C. Let's put this information in a table, in the total row.
To fill the cells in the first row, we multiply the percentages that support the liberal candidate in each state by the corresponding percent of people living in that state. P(A and Yes)&= 0.40(0.5)=0.20 P(B and Yes)&= 0.25(0.6)=0.15 P(C and Yes)&= 0.35(0.2)=0.07 Let's add this to the diagram and then sum all the values for liberal voters across the states. This gives the percentage of liberal voters in the three states.
As we can see, 42 % of all voters in the three states support the liberal candidate. Using the information from the table, we can determine the probability that a liberal voter lives in state B. To do so, we divide the percentage of liberal voters in State B by the percentage of liberal voters.
There is a 36 % probability that a liberal voter lives in state B.
security
report
code
A machine produces parts that are good 95% of the time, slightly defective 1% of the time, and totally defective 4% of the time. Every part that is produced gets inspected and all totally defective parts are thrown away. Given that a part is shipped, what is the probability that it was good? Round to the nearest percent.
{"type":"text","form":{"type":"math","options":{"comparison":"1","nofractofloat":false,"keypad":{"simple":true,"useShortLog":false,"variables":["x"],"constants":["PI"]},"rendered":false},"text":"<span class=\"katex\"><span class=\"katex-html\" aria-hidden=\"true\"><\/span><\/span>"},"formTextBefore":"<span class=\"katex\"><span class=\"katex-html\" aria-hidden=\"true\"><span class=\"base\"><span class=\"strut\" style=\"height:0.68333em;vertical-align:0em;\"><\/span><span class=\"mord mathdefault\" style=\"margin-right:0.13889em;\">P<\/span><span class=\"mspace\" style=\"margin-right:0.2777777777777778em;\"><\/span><span class=\"mrel\">=<\/span><\/span><\/span><\/span>","formTextAfter":"<span class=\"katex\"><span class=\"katex-html\" aria-hidden=\"true\"><span class=\"base\"><span class=\"strut\" style=\"height:0.80556em;vertical-align:-0.05556em;\"><\/span><span class=\"mspace\" style=\"margin-right:0.16666666666666666em;\"><\/span><span class=\"mord\">%<\/span><\/span><\/span><\/span>","answer":{"text":["99"]}}
security
report
code
security
report
code
There are three potential events for each part that is manufactured. Good& - 95 % Slightly defective& - 1 % Totally defective& - 4 % We know that the totally defective parts are thrown away. We want to determine the probability that a part is good given that it is shipped. The percentage of parts shipped equals the percentage of parts that were not totally defective. Since 4 % of all parts where totally defective, it must be that 96 % of all parts are shipped. If we label the event that a part gets shipped as S, we can write the following conditional probability. P(G|S)=P(G and S)/P(S) From the exercise, we know that 95 % of parts are good and we have also figured out that 96 % of all parts are shipped. Now we can calculate the conditional probability.
As we can see, about 99 % of all parts that are shipped are good.
security
report
code
The Relationship Between Independence and Conditional Probability
Recommended exercises
To get personalized recommended exercises, please login first.
Loading content
Loading content