Substitute some arbitrary values of x into the given equation.
Practice makes perfect
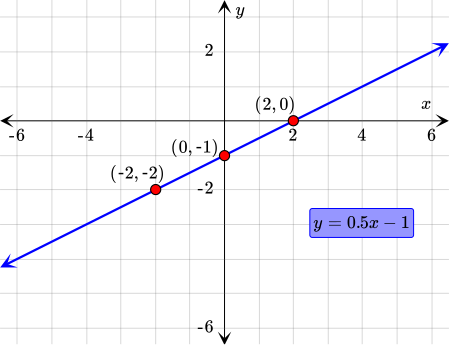
To draw the graph of the given equation, we will use a table of values. Substituting some arbitrary values of x into the given equation will give us the corresponding y-values.
x
0.5x - 1
y=0.5x - 1
- 2
0.5( - 2) - 1
- 2
0
0.5( 0) - 1
-1
2
0.5( 2) - 1
0
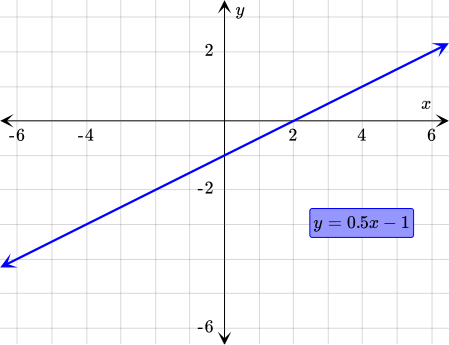
Now let's plot these ( x, y) coordinate pairs and connect them with a straight line.