1. Graphing Linear Equations Using a Table of Values
Sign In
An error ocurred, try again later!
Chapter 2
1.
Graphing Linear Equations Using a Table of Values
This lesson delves into the methods of graphing linear equations by utilizing tables of values. It provides a step-by-step approach, starting with choosing at least two x-values for the table. The relationship between variables is visualized through these tables, aiding in the graphing process. Real-life scenarios, such as Maya's book buying habits and Ramsha's earnings at a bakery, are used to illustrate the application of these methods. The essence of the lesson is to equip learners with the skills to visualize relationships between two variables and graph them accurately.
Show less Show more expand_more 


Lesson Settings & Tools
| | 10 Theory slides |
| | 10 Exercises - Grade E - A |
| | Each lesson is meant to take 1-2 classroom sessions |
Graphing Linear Equations Using a Table of Values
Slide of 10
Graphs of linear equations are useful for describing relationships between variables that change at a constant rate. They often outperform words or equations. Keeping in mind the definition of a linear equation in one variable, it will now be extended to two variables. This lesson will also cover the most basic method of graphing linear equations in two variables.
Catch-Up and Review
Here are a few recommended readings before getting started with this lesson.
Explore
Share
Report error
Plotting Points Corresponding to Linear Equations
Consider the following linear equations.
lc3=2x+1 & (I) 5=2x+1 & (II) 7=2x+1 & (III)
The right-hand sides of these equations are all the same. Now, each equation will be solved using the Properties of Equality.
The solutions of Equations (I), (II), and (III) are x=1, x=2, and x=3, respectively. The points corresponding to each equation will be plotted on one coordinate plane. First, the points must be identified. Their x-coordinates will be the solutions and their y-coordinates will be the left-hand sides of the original related equations.
Now the points can be plotted on a coordinate plane.
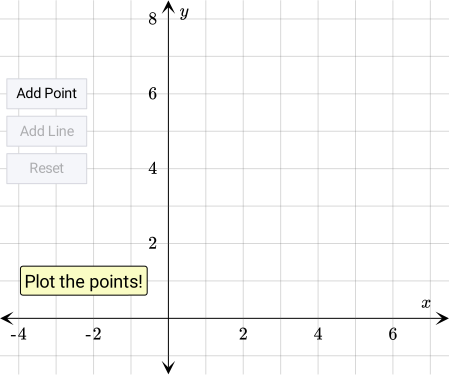 What can be noted about the points? What is the equation of the line that passes through them? Why?
l3=2x+1 5=2x+1 7=2x+1
▼
Solve for x
(I), (II), (III): LHS-1=RHS-1
l2=2x 4=2x 6=2x
(I), (II), (III): .LHS /2.=.RHS /2.
l1=x 2=x 3=x
(I), (II), (III): Rearrange equation
lx=1 x=2 x=3
| Equation | Solution | Point |
|---|---|---|
| 3=2x+1 | x= 1 | ( 1, 3) |
| 5=2x+1 | x= 2 | ( 2, 5) |
| 7=2x+1 | x= 3 | ( 3, 7) |
Discussion
Share
Report error
A Table of Values and How to Make It
A table of values is a chart that helps to organize and visualize information. It is frequently used to show the relation between two variables.
| x | y |
|---|---|
| 0 | 0 |
| 1 | 3 |
| 2 | 6 |
| 3 | 9 |
| 4 | 12 |
| 5 | 15 |
2corresponds to the y-value
6.This is usually represented with the notation (2,6).
The relation between the variables of an equation can be shown by making a table of values. This is helpful when graphing any equation, not only linear ones. The following linear equation will be drawn as an example.
6x-3y=- 12
There are four steps to making a table of values for an equation.
1
Isolate One Variable
expand_more If in the given equation none of the variables are isolated on one side, it is convenient to do so before making the table of values. This will simplify the rest of the process. A variable can be isolated using the Properties of Equality. If the variables presented in the equation are x and y, usually the latter one will be isolated.
Often the non-isolated variable is called the input and the isolated variable is called the output.
6x-3y=- 12
SubEqn
LHS-6x=RHS-6x
- 3y=- 6x-12
DivEqn
.LHS /(- 3).=.RHS /(- 3).
y=- 6x-12/- 3
▼
Simplify right-hand side
WriteSumFrac
Write as a sum of fractions
y=- 6x/- 3+- 12/- 3
DivNegNeg
- a/- b=a/b
y=6x/3+12/3
CalcQuot
Calculate quotient
y=2x+4
2
Choose the Values for the Non-Isolated Variable(s)
expand_more A table of values will usually have as many columns as there are variables plus one. In this case, the first column is for the values of the input. The second column is for substituting values from the first column into the rewritten equation. The third column shows the values of the output corresponding to its input.
| x | 2x+4 | y=2x+4 |
|---|
Next, the values of the non-isolated input variable x should be chosen. It can be done arbitrarily. However, the values should always belong to the domain of the function represented by the given equation. Recall that the domain of a linear function are all real numbers. In this case - 2, 0, 0.5, and 1 will be used.
| x | 2x+4 | y=2x+4 |
|---|---|---|
| - 2 | ||
| 0 | ||
| 0.5 | ||
| 1 |
3
Substitute the Values Into the Rewritten Equation
expand_more In this step the input values will be substituted into the rewritten equation where the output variable is isolated on the left-hand side.
| x | 2x+4 | y=2x+4 |
|---|---|---|
| - 2 | 2( - 2)+4 | |
| 0 | 2( 0)+4 | |
| 0.5 | 2( 0.5)+4 | |
| 1 | 2( 1)+4 |
4
Calculate the Values of the Isolated Variable
expand_more The last step is to simplify the expressions in the second column and write the result in the the last column. These are the outputs corresponding to the input from each row.
| x | 2x+4 | y=2x+4 |
|---|---|---|
| - 2 | 2( - 2)+4 | 0 |
| 0 | 2( 0)+4 | 4 |
| 0.5 | 2( 0.5)+4 | 5 |
| 1 | 2( 1)+4 | 6 |
If the expressions in the second column are too complicated to calculate mentally, extra columns where the partial results are written can be added as needed. However, the last column should always be the outputs.
| x | 2x+4 | Simplify | y=2x+4 |
|---|---|---|---|
| - 2 | 2( - 2)+4 | - 4+4 | 0 |
| 0 | 2( 0)+4 | 0+4 | 4 |
| 0.5 | 2( 0.5)+4 | 1+4 | 5 |
| 1 | 2( 1)+4 | 2+4 | 6 |
The table of values can be reduced to a table with only two columns — one with inputs and one with outputs. Note that for the output column we write only the variable.
| 6x-3y=- 12 | |
|---|---|
| x | y |
| - 2 | 0 |
| 0 | 4 |
| 0.5 | 5 |
| 1 | 6 |
Example
Share
Report error
Phone Plan
Zain is considering a new phone plan. Currently they spend $15 on their phone each month. The new plan consists of a $9 flat rate for which they get unlimited texts, 300 minutes, and 6GB of data. For any minute above the 300 minutes included in the plan, Zain will have to pay an additional $0.01.

{"type":"choice","form":{"alts":["Yes","No"],"noSort":false},"formTextBefore":"\"Should Zain switch to the new plan?\"","formTextAfter":"","answer":0}
Hint
Let y represent the total cost of the new phone plan. Let x represent the number of minutes used. Write an equation for y when x is greater than 300.
Solution
Let y represent the total cost of the new phone plan expressed in dollars. Let x represent the number of minutes used. If x is less than or equal to 300, y is equal to the flat rate of $9.
x≤ 300 ⇒ y= 9
If x is greater than 300, the cost of the minutes exceeding the 300 given minutes must be added to the flat rate. There are x-300 minutes that have to be payed for. Each of these minutes costs $0.01.
x> 300 ⇒ y= 9+(x-300) 0.01
The above equation for y can be simplified.
Now, the table of values for x and y will be formed. Let x be 350, 410, and 550. These are the numbers of minutes Zain used in the previous months. Since they never exceeded 600 minutes, this will be the highest considered value of x. Note that all considered values of x are greater than 300, so the expression for y is 0.01x+6.
y=9+(x-300)0.01
y=0.01x+6
| x | y=0.01x+6 | y |
|---|---|---|
| 350 | y=0.01( 350)+6 | 9.5 |
| 410 | y=0.01( 410)+6 | 10.1 |
| 550 | y=0.01( 550)+6 | 11.5 |
| 600 | y=0.01( 600)+6 | 12 |
For the full picture, the values of x=200 and x=300 will also be added to the table. Remember that when x≤ 300, the value of y is always equal to 9.
| Number of Minutes | Total Cost |
|---|---|
| 200 | $ 9 |
| 300 | $ 9 |
| 350 | $ 9.5 |
| 410 | $ 10.1 |
| 550 | $ 11.5 |
| 600 | $ 12 |
Currently Zain spends $15 on their phone plan. It can be noted that all of the prices in the above table are less than $15. Assuming Zain does not change their talking habits and 6GB is enough data for them, they should switch to the new plan.
Discussion
Share
Report error
Linear Equation and Graph of Its Solutions
A linear equation is an equation with at least one linear term and any number of constants. No other types of terms may be included. Linear equations in one variable have the following form, where a and b are real numbers and a≠ 0.
ax+b=0 or ax = b
Linear equations in two variables have the form below, where a, b, and c are real numbers and a≠ 0 and b≠ 0.
ax+by+c=0 or ax+by = c
A line is a one-dimensional object of infinite length with no width or thickness that never bends or turns. Its graphical representation is a straight line with arrowheads on either end, indicating that it continues indefinitely in both directions.
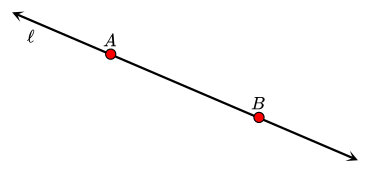
The graph of a linear equation in two variables is the set of all its solutions plotted on the same coordinate plane, forming a line. Since a line is infinite, this means that a linear equation in two variables has infinitely many solutions.
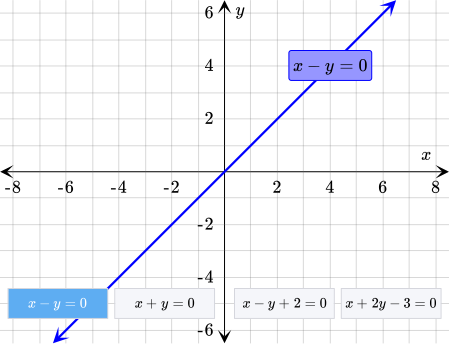
Pop Quiz
Share
Report error
Identifying Linear Equations
Consider the given equation in two variables. Determine whether it is a linear equation or not.
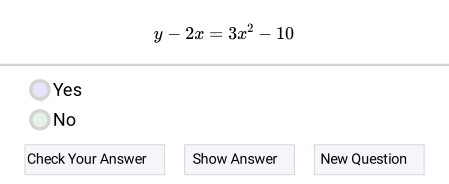
Example
Share
Report error
December Pay
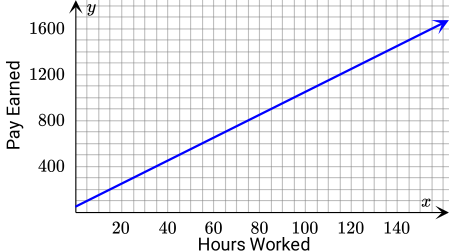
Ramsha works in a bakery. She earns $ 10 per hour. Since it is December, she will get a bonus of $ 50 this month.

Answer
Hint
Choose at least two x-values for the table of values. Since x represents the number of hours worked, it must be greater than 0.
Solution
The given linear equation will be graphed using a table of values. y=10x+50 The graph of a linear equation in two variables is a line. There is exactly one line that passes through any two different points. Therefore, at least two different values of x need to be evaluated in the table of values. Also, x must be greater than 0 as it represents the number of hours worked.
| x | y=10x+50 | y |
|---|---|---|
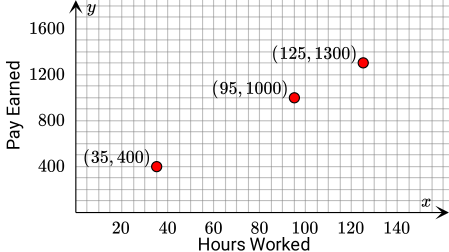
| 35 | y=10( 35)+50 | 400 |
| 95 | y=10( 95)+50 | 1000 |
| 125 | y=10( 125)+50 | 1300 |
Each pair of x and y corresponds to an ( x, y) coordinate pair. Now (35,400), (95,1000), and (125,1300) will be plotted on the same coordinate plane.
Finally, the three points can be connected using a straightedge.
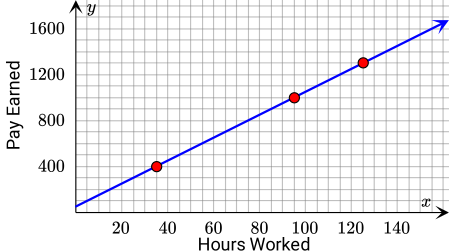
Since in the given case x cannot be negative, the graph includes only one arrowhead and is actually a ray.
Example
Share
Report error
Graphing a Linear Equation in Standard Form
Maya loves reading. She is buying books at a garage sale.

Answer
Graph:
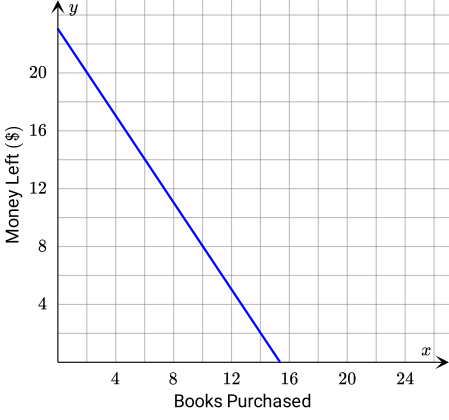
Maximum Number of Books: 15
Hint
Choose at least two x-values for the table of values.
Solution
First, the given equation will be graphed. Then the obtained graph will be used to determine the maximum number of books that Maya can purchase.
Graphing the Equation
Before making the table of values for the given equation, one of the variables has to be isolated. It is more common to isolate y, so let it also be the case here.3x+2y=46
▼
Solve for y
SubEqn
LHS-3x=RHS-3x
2y=- 3x+46
DivEqn
.LHS /2.=.RHS /2.
y=- 3x+46/2
WriteSumFrac
Write as a sum of fractions
y=- 3x/2+46/2
CalcQuot
Calculate quotient
y=- 1.5x+23
| x | y=- 1.5x+23 | y |
|---|---|---|
| 0 | y=- 1.5( 0)+23 | 23 |
| 2 | y=- 1.5( 2)+23 | 20 |
| 4 | y=- 1.5( 4)+23 | 17 |
| 10 | y=- 1.5( 10)+23 | 8 |
Note that in order to simplify the graphing process, the chosen x-values are all even numbers. Each pair of x and y corresponds to a coordinate pair ( x, y). Now (0,23), (2,20), (4,17), and (10,8) will be plotted on the same coordinate plane.
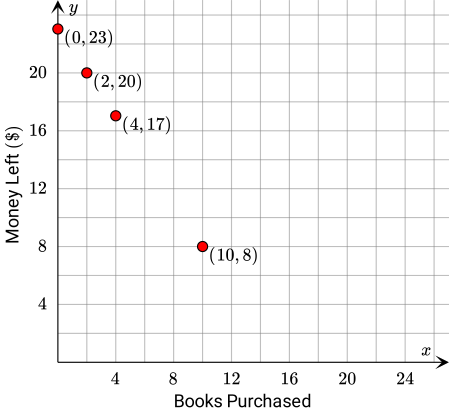
Finally, the four points can be connected using a straightedge.
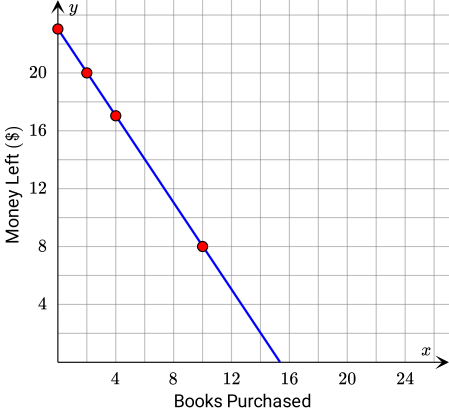
Since the amount y of money left and the number x of books purchased cannot be negative, the graph is bounded only to the first quadrant. This also means that only part of the line is actually considered, which makes it a segment.
Finding the Maximum Number of Books
Note that the number of books has to be a whole number, as Maya cannot buy part
of a book. Also, she cannot spend more money than she has, which means that the amount of money left has to be non-negative. A point which meets these conditions, the maximum value of the x-coordinate, can be identified on the graph.
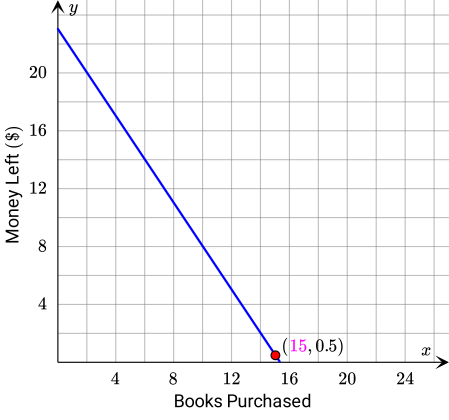
The x-coordinate of the point corresponds to the maximum number of books that Maya can buy. As seen on the graph, its value is 15. Therefore, Maya can purchase at most 15 books.
Pop Quiz
Share
Report error
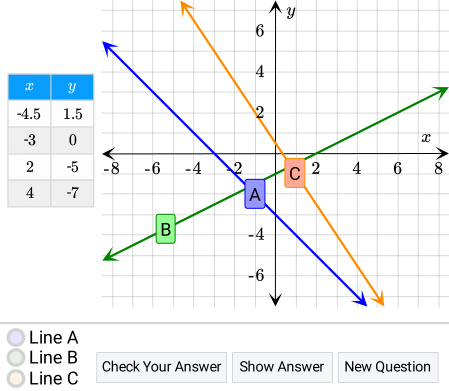
Matching a Line to a Table of Values
Closure
Share
Report error
Solving a Linear Equation by Graphing
Equations in one variable can be solved by using the properties of equality. Consider the following equation in one variable. 2x+1=5x-5 This type of equation can also be solved by graphing the linear equations in two variables corresponding to the left- and right-hand sides of the given equation. 2x+1=5x-5 ⇒ lcy=2x+1 & (I) y=5x-5 & (II) Equations (I) and (II) will be graphed on one coordinate plane using a table of values. First, the table of values for Equation (I) will be made. Remember that at least two different values of x have to be evaluated in the table.
| x | y=2x+1 | y |
|---|---|---|
| 0 | y=2( 0)+1 | 1 |
| 1 | y=2( 1)+1 | 3 |
The line passing through (0,1) and (1,3) is the graph of y=2x+1. Now the table for Equation (II) will be constructed.
| x | y=5x-5 | y |
|---|---|---|
| 0 | y=5( 0)-5 | - 5 |
| 1 | y=5( 1)-5 | 0 |
The line passing through (0,- 5) and (1,0) is the graph of y=5x-5.
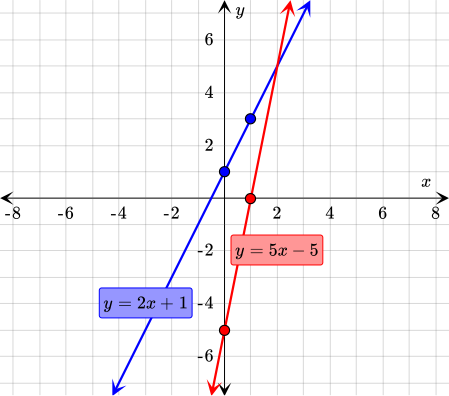
Finally, the point of intersection of y=2x+1 and y=5x-5 can be identified.
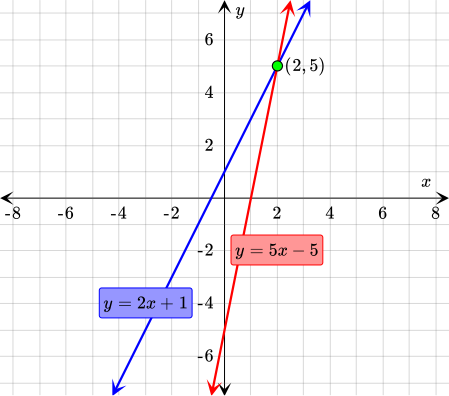
The lines intersect at ( 2, 5). This means that both 2x+1 and 5x-5 equal 5 when x= 2.
| Expression | x=2 | Simplify |
|---|---|---|
| 2x+1 | 2( 2)+1 | 5 |
| 5x-5 | 5( 2)-5 | 5 |
Graphing Linear Equations Using a Table of Values
Exercise 2.1
Emily drinks milk after eating brownies, often getting a milk mustache. Naturally, she is a curious person and would like to model the height of the milk in the carton as she drinks.

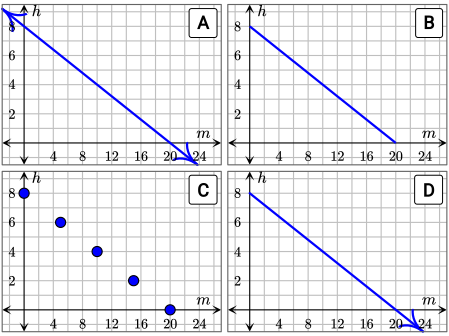
Consider the following linear equation with two variables. h=8-0.4m Here, h represents the height of milk in a 20-ounce carton in inches, and m represents the amount of milk drank in ounces. Considering the given situation, which of the graphs corresponds to the equation?
{"type":"choice","form":{"alts":["A","B","C","D"],"noSort":true},"formTextBefore":"","formTextAfter":"","answer":1}
security
report
code
security
report
code
We will graph the equation by making a table of values. First, we will identify the values of m that make sense in the described situation. We know that the glass contains 20 ounces. This amount can only decrease as the milk is drank and can never become a negative number, so only the values of m between 0 and 20 are reasonable. 0≤ m ≤ 20 Now, we can make a table of values. Remember that at least two different values of m have to be evaluated in the table. In this case, we will start with m=0 and increase the value by 5 until we reach 20.
| m | h=8-0.4m | h |
|---|---|---|
| 0 | h=8-0.4( 0) | 8 |
| 5 | h=8-0.4( 5) | 6 |
| 10 | h=8-0.4( 10) | 4 |
| 15 | h=8-0.4( 15) | 2 |
| 20 | h=8-0.4( 20) | 0 |
As we can see, the starting height of the milk in the carton is 8 inches. The height decreases as the amount of milk drank increases. When 20 ounces of milk are drank, the height of milk is 0 because the carton is then empty. Therefore, the height of milk in the carton has to be between 0 and 8 inches. 0≤ h ≤ 8 Now, using the m- and h-values from the table as (m,h) coordinate pairs, we can plot the points. Connecting these points using a straightedge will give us the graph representing the given situation.
Note that the graph does not extend further to the left or down because negative values of m and h do not make sense in this situation. This graph corresponds to option B.
security
report
code
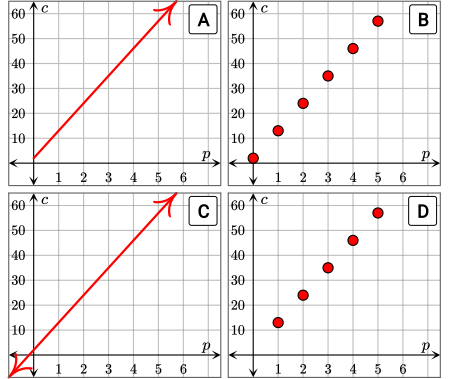
Consider the following linear equation in two variables. c=2+11p Here, c represents the cost in dollars of having p pizzas delivered. Which of the graphs corresponds to the equation in respect to the given situation?
{"type":"choice","form":{"alts":["A","B","C","D"],"noSort":true},"formTextBefore":"","formTextAfter":"","answer":3}
security
report
code
security
report
code
We will graph the equation by making a table of values. Let's first identify the values of p that make sense in the described situation. Since we can only order whole pizzas and the number of pizzas has to be positive, the values of p must be natural numbers. p∈{1,2,3,4,5, ... } Now we can construct the table of values. The values of p can be chosen arbitrarily.
| p | c=2+11p | c |
|---|---|---|
| 1 | c=2+11( 1) | 13 |
| 2 | c=2+11( 2) | 24 |
| 3 | c=2+11( 3) | 35 |
| 4 | c=2+11( 4) | 46 |
| 5 | c=2+11( 5) | 57 |
Using the p and c values as (p,c) coordinate pairs, we can plot the points.
Notice that we do not connect the points using a straightedge, because p takes only natural numbers as values. The graph continues for the remaining values of p in the same pattern — following the line c=2+11p. This graph corresponds to option D.
security
report
code
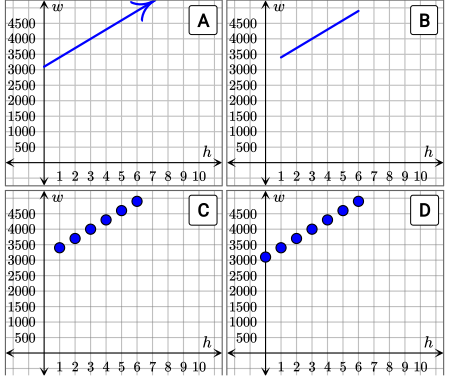
Consider the following linear equation in two variables. w=3100+300h Here, w is the average total weight in kilograms of an aluminum horse trailer carrying h horses. This trailer can carry at most 6 horses. Which of the graphs corresponds to the equation in respect to the given situation?
{"type":"choice","form":{"alts":["A","B","C","D"],"noSort":true},"formTextBefore":"","formTextAfter":"","answer":3}
security
report
code
security
report
code
We will graph the equation by making a table of values. Let's first identify the values of h that make sense in the described situation. The number of horses loaded onto the trailer cannot exceed 6 and cannot be negative but it can be equal to zero. Also, a part of a horse
cannot be loaded onto the trailer.
h∈{0,1,2,3,4,5,6}
Now we can make the table of values. Since there are not many possible values of h, let's use all of them in the table.
| h | w=3100+300h | w |
|---|---|---|
| 0 | w=3100+300( 0) | 3100 |
| 1 | w=3100+300( 1) | 3400 |
| 2 | w=3100+300( 2) | 3700 |
| 3 | w=3100+300( 3) | 4000 |
| 4 | w=3100+300( 4) | 4300 |
| 5 | w=3100+300( 5) | 4600 |
| 6 | w=3100+300( 6) | 4900 |
Using the h- and w-values as (h,w) coordinate pairs, we can plot all of the points.
Note that the points should not be connected using a straightedge nor does the graph extend further in any direction. This graph corresponds to option D.
security
report
code
Graphing Linear Equations Using a Table of Values
Recommended exercises
To get personalized recommended exercises, please login first.
Loading content
≤
>
■2
■▢
e▢
7
8
9
×
÷■1
=
=
√▢
▢√
∫▢▢
4
5
6
+
−
≤
<
log
ln
log▢
1
2
3
()
∣
sin
cos
tan
0
.
π
x
y
Loading content