Table of contents
Sign In
An error ocurred, try again later!
Chapter 7
1.
Constant Rate of Change and Slope
The concepts of constant rate of change and slope are essential in mathematics and real-world applications. This lesson provides a clear understanding of how changes between variables can be measured consistently. It explains how to interpret graphs to find slopes and discusses the role of the slope formula in analyzing relationships between points. By mastering these concepts, students can enhance their ability to solve problems related to linear relationships and improve their critical thinking skills in areas like physics, economics, and engineering.
Show less Show more expand_more Lesson Settings & Tools
| | 14 Theory slides |
| | 11 Exercises - Grade E - A |
| | Each lesson is meant to take 1-2 classroom sessions |
Constant Rate of Change and Slope
Slide of 14
Mathematics helps people with many things in life like understanding the changes between variables, and in making predictions. This lesson introduces the concept of a rate of change and how it translates to a visual graph. In addition to that, the relationship between constant rate of change and the concept of slope is covered.
Catch-Up and Review
Here are a few recommended readings before getting started with this lesson.
Challenge
Wheelchair Ramp
At Jefferson High, a local volunteer group wants to construct a wheelchair ramp located at the school's entrance. LaShay is helping with the project and she is given a model of the ramp. It is represented on a coordinate plane.
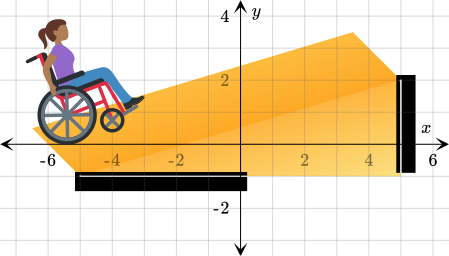
The slope of the ramp must be less than 0.2 for a person on a wheelchair to be able to use it comfortably. Help LaShay determine the slope, and then tell the ramp makers if the plan is acceptable
or not acceptable.
{"type":"choice","form":{"alts":["The slope is <span class=\"katex\"><span class=\"katex-html\" aria-hidden=\"true\"><span class=\"base\"><span class=\"strut\" style=\"height:0.64444em;vertical-align:0em;\"><\/span><span class=\"mord\">0<\/span><span class=\"mord\">.<\/span><span class=\"mord\">3<\/span><span class=\"mord\">.<\/span><\/span><\/span><\/span> It is not acceptable.","The slope is <span class=\"katex\"><span class=\"katex-html\" aria-hidden=\"true\"><span class=\"base\"><span class=\"strut\" style=\"height:0.64444em;vertical-align:0em;\"><\/span><span class=\"mord\">0<\/span><span class=\"mord\">.<\/span><span class=\"mord\">1<\/span><span class=\"mord\">3<\/span><span class=\"mord\">.<\/span><\/span><\/span><\/span> It is acceptable.","The slope is <span class=\"katex\"><span class=\"katex-html\" aria-hidden=\"true\"><span class=\"base\"><span class=\"strut\" style=\"height:0.64444em;vertical-align:0em;\"><\/span><span class=\"mord\">0<\/span><span class=\"mord\">.<\/span><span class=\"mord\">5<\/span><span class=\"mord\">3<\/span><span class=\"mord\">.<\/span><\/span><\/span><\/span> It is not acceptable.","The slope is <span class=\"katex\"><span class=\"katex-html\" aria-hidden=\"true\"><span class=\"base\"><span class=\"strut\" style=\"height:0.64444em;vertical-align:0em;\"><\/span><span class=\"mord\">0<\/span><span class=\"mord\">.<\/span><span class=\"mord\">2<\/span><span class=\"mord\">.<\/span><\/span><\/span><\/span> It is acceptable."],"noSort":false},"formTextBefore":"","formTextAfter":"","answer":0}
Discussion
What Is a Rate of Change?
In order to understand the relationship between two quantities and make predictions about their behavior, it is important to be able to compare and quantify how one changes with respect to the other. These ideas define the concept of rate of change.
Concept
Rate of Change
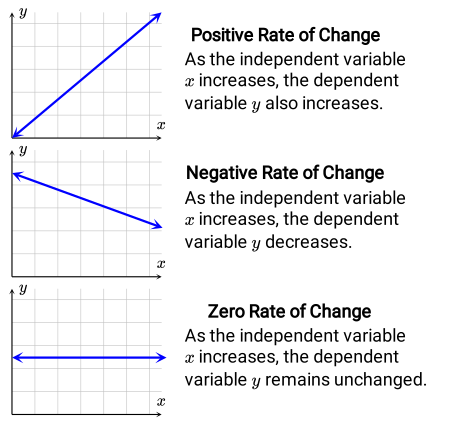
The rate of change ROC is a ratio used to compare how a variable changes in relation to another variable. It is determined by dividing the change in the output variable y by the change in the input variable x. For any ordered pairs (x1,y1) and (x2,y2), the rate of change is calculated using the following formula.
Rate of ChangeRate of Change=Change in xChange in y=x2−x1y2−y1
The Greek letter Δ (Delta) is commonly used to represent a difference. This leads to an alternative way of writing the formula for ROC.
Rate of Change=ΔxΔy
Extra
Rate of Change UnitsThe units of a rate of change are the ratio of output units to the input units, meaning that they are derived units. Interpreting the rate of change depends on the context.
| Output Units | Input Units | Rate of Change Units | Possible Interpretation |
|---|---|---|---|
| meters | seconds | secondmeters | Car speed over a certain period of time |
| bacteria | hours | hourbacteria | Growth rate of bacteria in an experiment |
| U.S. dollars | hours | hourU.S. dollars | Worker's hourly wage |
Explore
Rate of Change Between the Points of a Line
Calculate the rate of change between different pairs of points on a line.
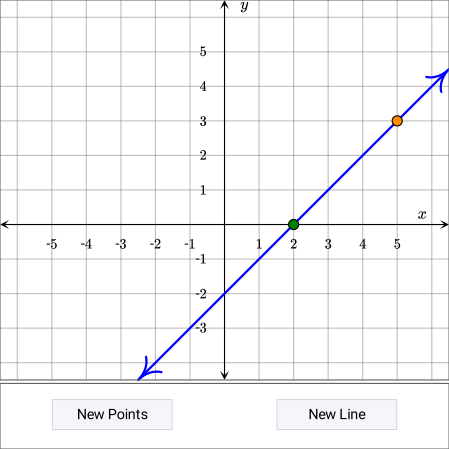 What can be concluded about the rate of change between those points? Try several times using new lines and points.
Discussion
Constant Rate of Change
Any line in the coordinate plane has a constant rate of change between any pair of its points. This can be checked by moving the points in the following applet.
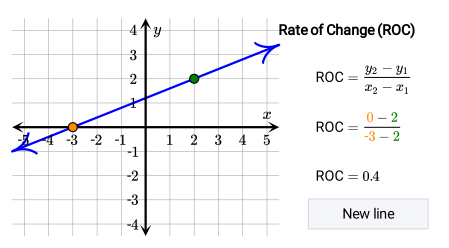 The opposite of this statement also holds true. If the rate of change between consecutive pairs of points of a data set is constant, then these points follow a linear relation and they all lie on the same line in the coordinate plane. The following applet illustrates this.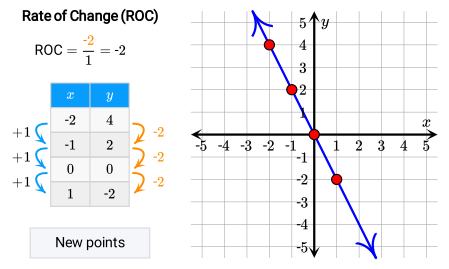
Example
Download Speed
LaShay, a student who volunteers often, is really into learning how to build accessible places for people of all abilities. She is now downloading a package of design files created by professional designers. It explains how to make such places.

The school library's internet speed allows her to download 5 megabytes (MB) of data each minute. This is shown in the following table.

a Compare the change in data y to the change in time x. What is the rate of change?
{"type":"text","form":{"type":"math","options":{"comparison":"1","nofractofloat":false,"keypad":{"simple":true,"useShortLog":false,"variables":["x"],"constants":["PI"]},"rendered":false},"text":"<span class=\"katex\"><span class=\"katex-html\" aria-hidden=\"true\"><\/span><\/span>"},"formTextBefore":null,"formTextAfter":"MB\/min","answer":{"text":["5"]}}
b Fill in the blank in the table. How many megabytes of data will be downloaded after 5 minutes?
{"type":"text","form":{"type":"math","options":{"comparison":"1","nofractofloat":false,"keypad":{"simple":true,"useShortLog":false,"variables":["x"],"constants":["PI"]},"rendered":false},"text":"<span class=\"katex\"><span class=\"katex-html\" aria-hidden=\"true\"><\/span><\/span>"},"formTextBefore":null,"formTextAfter":"MB","answer":{"text":["25"]}}
c Do the data points lie on the same line?
{"type":"choice","form":{"alts":["Yes","No"],"noSort":true},"formTextBefore":"","formTextAfter":"","answer":0}
d If the size of the file package is 600 megabytes, how long will it take to download?
{"type":"text","form":{"type":"math","options":{"comparison":"1","nofractofloat":false,"keypad":{"simple":true,"useShortLog":false,"variables":["x"],"constants":["PI"]},"rendered":false},"text":"<span class=\"katex\"><span class=\"katex-html\" aria-hidden=\"true\"><\/span><\/span>"},"formTextBefore":null,"formTextAfter":"minutes","answer":{"text":["120"]}}
Hint
a Begin by finding the amount of change between consecutive numbers. Notice that the rate of change between consecutive numbers is constant.
b Use the rate of change to predict the amount of data downloaded after 5 minutes.
c Plot the data points on the coordinate plane. Try to draw a line that passes through them.
d Divide the size of the file package by the rate of change.
Solution
a Begin by finding the amount of change between consecutive numbers.
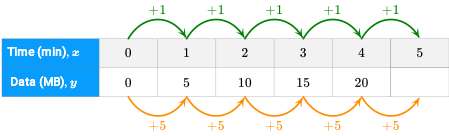
Rate of Change=1 min5 MB
The rate of change is 5 megabytes per minute.
b Recall that the rate of change is 5 megabytes per minute and is constant. Therefore, the amount of data downloaded after 5 minutes can be found by adding 5 to the number in the previous column, which is 20.
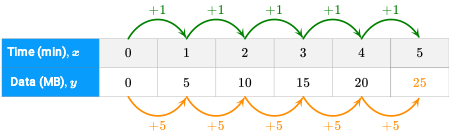
The amount of data downloaded after 5 minutes is 25 MB.
c Begin by writing the data points from the table as ordered pairs.
(0,0), (1,5), (2,10),(3,15), (4,20), (5,25)
Next, plot them on the coordinate plane. Note that the time and amount of data cannot be negative, so only the first quadrant will be considered. 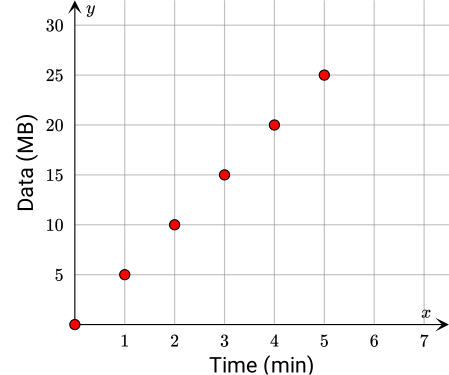
Finally, try to draw a line passing through these points.
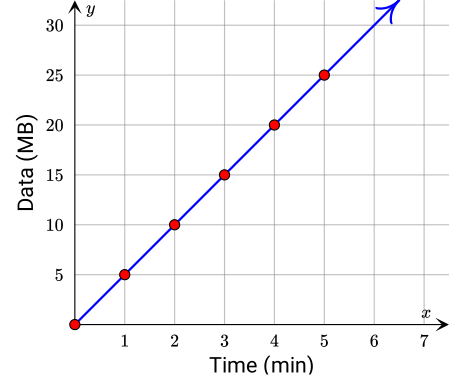
As shown, all of the points lie on the line. This makes sense because the rate of change is constant.
d Now it is time to find out precisely how long it takes to download the 600-megabyte file. This can be done by dividing its size by the rate of change. Recall that the rate of change is 5 megabytes per minute.
5600=120
It will take 120 minutes for LaShay to download the design package — it contains a few photo books and magazines! She will then be ready to read through it all and get one step closer to realizing her dreams!
Discussion
Slope of a Linear Relationship
The rate of change of a linear relation, which is constant, has a special name — slope.
Concept
Slope
The slope of a line passing through the points (x1,y1) and (x2,y2) is the ratio of the vertical change — the change in y-values — to the horizontal change — the change in x-values — between the points. The variable m is most commonly used to represent the slope, and the variable k is also used.
m=change in x-valuechange in y-value
The phrase rise over run
is commonly used to describe the slope of a line, especially when the line is given graphically. Rise
refers to change in y-value and run
refers to change in x-value. The right triangle used to visualize the rise and run between two points on the graph of a line is called slope triangle.
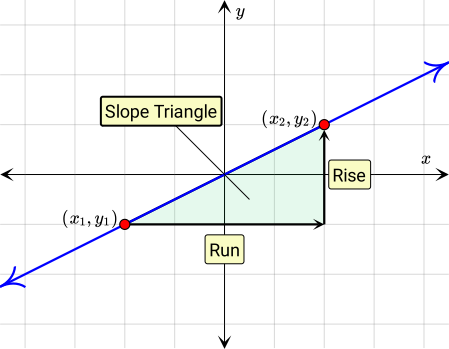
The definition of the slope of a line can be written in terms of its rise over its run.
m=runrise
The sign of each distance matches the direction of the movement between the points. The run is positive if the direction moves right. Whereas, the run is negative if the direction moves left. Similarly, moving upward results in a positive rise, while moving downward results in a negative rise.
Extra
Interactively Explore Directions of Rise and RunThe following applet shows how the directions of the rise and run affects the function graph. Change the direction by pushing ⬆️, ⬇️, ➡️, and ⬅️ buttons.
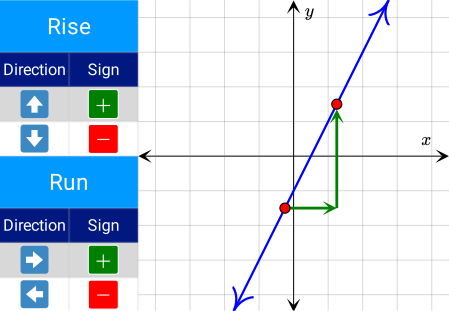 In most cases, the run’s direction is considered as moving to the right. Recall that the direction of the rise determines the sign of the slope. In addition, the sign of the slope is the product between the signs of the rise and run.
Discussion
Determining the Slope of a Line
There are different ways to determine the slope of a line. Which method to use depends on how the relation is expressed.
Method
Determining the Slope of a Line From Its Graph
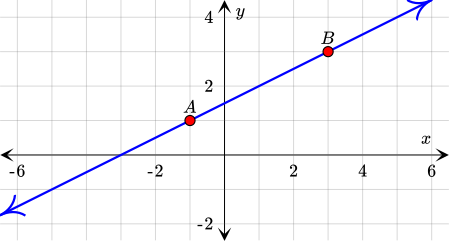
The slope of a line measures the change between points on the line. When presented graphically, it is common to use the following definition of slope. 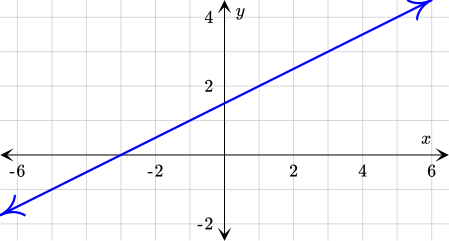 The slope of this line can be found using the following four steps.
m=runrise
Consider the following line. 1
Mark Two Points on the Line
expand_more To begin, mark any two points on the line. It is helpful to mark points with integer coordinates. This helps with accuracy.
From here, it is necessary to determine the rise and run between the points. Note that this can be done in either order.
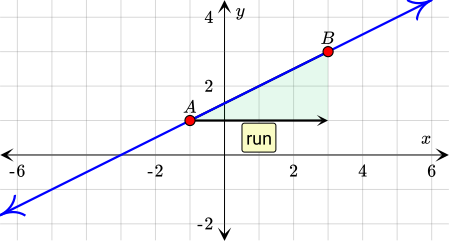
2
Determine the Run
expand_more Draw a line from A to the x-coordinate of point B to determine the horizontal distance between the points. Then, count the number of steps the line segment spans. Recall that moving to the right results in a positive run, while moving to the left results in a negative run.
In this graph, the run spans 4 units and it is positive.
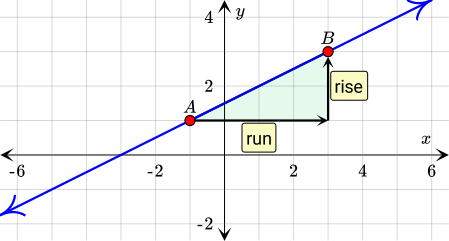
3
Determine the Rise
expand_more The rise between points can be found in the same way. Remember, moving up results in a positive rise and moving down results in a negative rise.
The rise spans 2 units and it is also positive.
4
Write the Slope Ratio
expand_more The slope ratio can now be written using the run and rise. Remember to simplify if possible.
The slope of this line is 21, or 0.5.
Example
Design Inspiration and Reading Pace
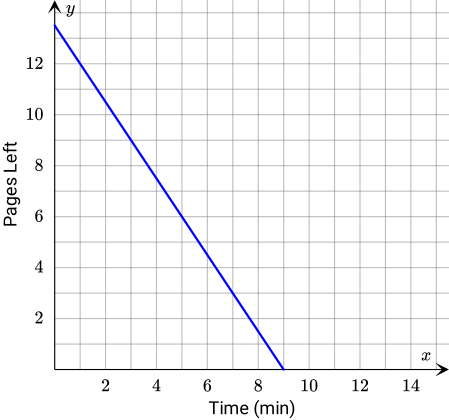
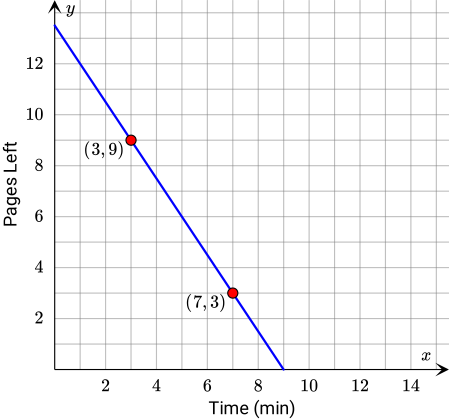
After downloading the design files, LaShay found a quiet spot in the library to dive into all the cool ideas. She feels inspired after seeing the design of this great accessible park.  LaShay realizes that reading through all of these great designs could take quite some time. She already read through quite a few pages. The following graph shows the number of pages left to read and the time she figures it will take.
{"type":"choice","form":{"alts":["The slope is <span class=\"katex\"><span class=\"katex-html\" aria-hidden=\"true\"><span class=\"base\"><span class=\"strut\" style=\"height:0.64444em;vertical-align:0em;\"><\/span><span class=\"mord text\"><span class=\"mord\">-<\/span><\/span><span class=\"mord\">1<\/span><span class=\"mord\">.<\/span><span class=\"mord\">5<\/span><span class=\"mord\">.<\/span><\/span><\/span><\/span> This means that LaShay reads <span class=\"katex\"><span class=\"katex-html\" aria-hidden=\"true\"><span class=\"base\"><span class=\"strut\" style=\"height:0.64444em;vertical-align:0em;\"><\/span><span class=\"mord\">1<\/span><span class=\"mord\">.<\/span><span class=\"mord\">5<\/span><\/span><\/span><\/span> pages per minute.","The slope is <span class=\"katex\"><span class=\"katex-html\" aria-hidden=\"true\"><span class=\"base\"><span class=\"strut\" style=\"height:1.190108em;vertical-align:-0.345em;\"><\/span><span class=\"mord text\"><span class=\"mord\">-<\/span><\/span><span class=\"mord\"><span class=\"mopen nulldelimiter\"><\/span><span class=\"mfrac\"><span class=\"vlist-t vlist-t2\"><span class=\"vlist-r\"><span class=\"vlist\" style=\"height:0.845108em;\"><span style=\"top:-2.6550000000000002em;\"><span class=\"pstrut\" style=\"height:3em;\"><\/span><span class=\"sizing reset-size6 size3 mtight\"><span class=\"mord mtight\"><span class=\"mord mtight\">3<\/span><\/span><\/span><\/span><span style=\"top:-3.23em;\"><span class=\"pstrut\" style=\"height:3em;\"><\/span><span class=\"frac-line\" style=\"border-bottom-width:0.04em;\"><\/span><\/span><span style=\"top:-3.394em;\"><span class=\"pstrut\" style=\"height:3em;\"><\/span><span class=\"sizing reset-size6 size3 mtight\"><span class=\"mord mtight\"><span class=\"mord mtight\">2<\/span><\/span><\/span><\/span><\/span><span class=\"vlist-s\">\u200b<\/span><\/span><span class=\"vlist-r\"><span class=\"vlist\" style=\"height:0.345em;\"><span><\/span><\/span><\/span><\/span><\/span><span class=\"mclose nulldelimiter\"><\/span><\/span><span class=\"mord\">.<\/span><\/span><\/span><\/span> This means that LaShay reads <span class=\"katex\"><span class=\"katex-html\" aria-hidden=\"true\"><span class=\"base\"><span class=\"strut\" style=\"height:1.190108em;vertical-align:-0.345em;\"><\/span><span class=\"mord\"><span class=\"mopen nulldelimiter\"><\/span><span class=\"mfrac\"><span class=\"vlist-t vlist-t2\"><span class=\"vlist-r\"><span class=\"vlist\" style=\"height:0.845108em;\"><span style=\"top:-2.6550000000000002em;\"><span class=\"pstrut\" style=\"height:3em;\"><\/span><span class=\"sizing reset-size6 size3 mtight\"><span class=\"mord mtight\"><span class=\"mord mtight\">3<\/span><\/span><\/span><\/span><span style=\"top:-3.23em;\"><span class=\"pstrut\" style=\"height:3em;\"><\/span><span class=\"frac-line\" style=\"border-bottom-width:0.04em;\"><\/span><\/span><span style=\"top:-3.394em;\"><span class=\"pstrut\" style=\"height:3em;\"><\/span><span class=\"sizing reset-size6 size3 mtight\"><span class=\"mord mtight\"><span class=\"mord mtight\">2<\/span><\/span><\/span><\/span><\/span><span class=\"vlist-s\">\u200b<\/span><\/span><span class=\"vlist-r\"><span class=\"vlist\" style=\"height:0.345em;\"><span><\/span><\/span><\/span><\/span><\/span><span class=\"mclose nulldelimiter\"><\/span><\/span><\/span><\/span><\/span> pages per minute.","The slope is <span class=\"katex\"><span class=\"katex-html\" aria-hidden=\"true\"><span class=\"base\"><span class=\"strut\" style=\"height:0.64444em;vertical-align:0em;\"><\/span><span class=\"mord text\"><span class=\"mord\">-<\/span><\/span><span class=\"mord\">1<\/span><span class=\"mord\">.<\/span><span class=\"mord\">5<\/span><span class=\"mord\">.<\/span><\/span><\/span><\/span> This means that LaShay reads <span class=\"katex\"><span class=\"katex-html\" aria-hidden=\"true\"><span class=\"base\"><span class=\"strut\" style=\"height:0.64444em;vertical-align:0em;\"><\/span><span class=\"mord\">1<\/span><\/span><\/span><\/span> page per <span class=\"katex\"><span class=\"katex-html\" aria-hidden=\"true\"><span class=\"base\"><span class=\"strut\" style=\"height:0.64444em;vertical-align:0em;\"><\/span><span class=\"mord\">1<\/span><span class=\"mord\">.<\/span><span class=\"mord\">5<\/span><\/span><\/span><\/span> minutes.","The slope is <span class=\"katex\"><span class=\"katex-html\" aria-hidden=\"true\"><span class=\"base\"><span class=\"strut\" style=\"height:1.190108em;vertical-align:-0.345em;\"><\/span><span class=\"mord text\"><span class=\"mord\">-<\/span><\/span><span class=\"mord\"><span class=\"mopen nulldelimiter\"><\/span><span class=\"mfrac\"><span class=\"vlist-t vlist-t2\"><span class=\"vlist-r\"><span class=\"vlist\" style=\"height:0.845108em;\"><span style=\"top:-2.6550000000000002em;\"><span class=\"pstrut\" style=\"height:3em;\"><\/span><span class=\"sizing reset-size6 size3 mtight\"><span class=\"mord mtight\"><span class=\"mord mtight\">3<\/span><\/span><\/span><\/span><span style=\"top:-3.23em;\"><span class=\"pstrut\" style=\"height:3em;\"><\/span><span class=\"frac-line\" style=\"border-bottom-width:0.04em;\"><\/span><\/span><span style=\"top:-3.394em;\"><span class=\"pstrut\" style=\"height:3em;\"><\/span><span class=\"sizing reset-size6 size3 mtight\"><span class=\"mord mtight\"><span class=\"mord mtight\">2<\/span><\/span><\/span><\/span><\/span><span class=\"vlist-s\">\u200b<\/span><\/span><span class=\"vlist-r\"><span class=\"vlist\" style=\"height:0.345em;\"><span><\/span><\/span><\/span><\/span><\/span><span class=\"mclose nulldelimiter\"><\/span><\/span><span class=\"mord\">.<\/span><\/span><\/span><\/span> This means that LaShay reads <span class=\"katex\"><span class=\"katex-html\" aria-hidden=\"true\"><span class=\"base\"><span class=\"strut\" style=\"height:0.64444em;vertical-align:0em;\"><\/span><span class=\"mord\">1<\/span><\/span><\/span><\/span> page per <span class=\"katex\"><span class=\"katex-html\" aria-hidden=\"true\"><span class=\"base\"><span class=\"strut\" style=\"height:1.190108em;vertical-align:-0.345em;\"><\/span><span class=\"mord\"><span class=\"mopen nulldelimiter\"><\/span><span class=\"mfrac\"><span class=\"vlist-t vlist-t2\"><span class=\"vlist-r\"><span class=\"vlist\" style=\"height:0.845108em;\"><span style=\"top:-2.6550000000000002em;\"><span class=\"pstrut\" style=\"height:3em;\"><\/span><span class=\"sizing reset-size6 size3 mtight\"><span class=\"mord mtight\"><span class=\"mord mtight\">3<\/span><\/span><\/span><\/span><span style=\"top:-3.23em;\"><span class=\"pstrut\" style=\"height:3em;\"><\/span><span class=\"frac-line\" style=\"border-bottom-width:0.04em;\"><\/span><\/span><span style=\"top:-3.394em;\"><span class=\"pstrut\" style=\"height:3em;\"><\/span><span class=\"sizing reset-size6 size3 mtight\"><span class=\"mord mtight\"><span class=\"mord mtight\">2<\/span><\/span><\/span><\/span><\/span><span class=\"vlist-s\">\u200b<\/span><\/span><span class=\"vlist-r\"><span class=\"vlist\" style=\"height:0.345em;\"><span><\/span><\/span><\/span><\/span><\/span><span class=\"mclose nulldelimiter\"><\/span><\/span><\/span><\/span><\/span> minutes."],"noSort":false},"formTextBefore":"","formTextAfter":"","answer":0}
Hint
Mark any two points on the line. Then, calculate the rise and run between them.
Solution
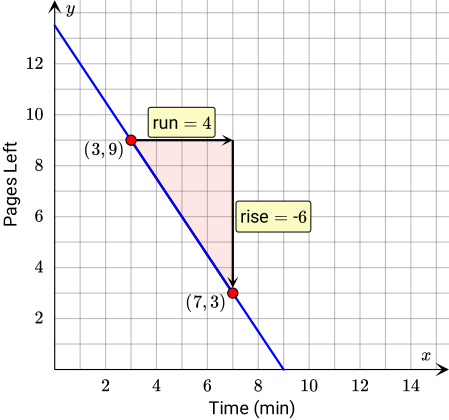
Begin by identifying any two points on the line. This is to find the slope of the relation. Notice that the line passes through the points (3,9) and (7,3).
Next, determine the rise and run between the two points.
m=runrise
SubstituteII
rise=-6, run=4
m=4-6
MoveNegNumToFrac
Put minus sign in front of fraction
m=-46
CalcQuot
Calculate quotient
m=-1.5
Pop Quiz
Finding the Slope of a Line
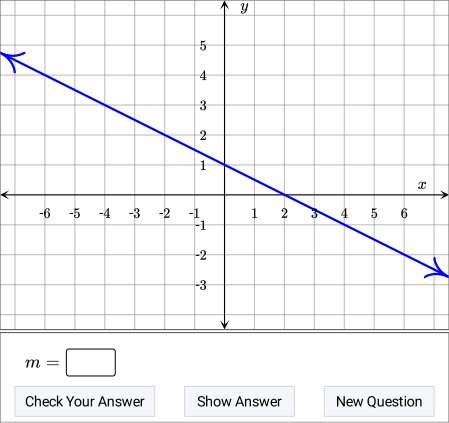
Find the slope of the given line by determining the rise and run. Write the answers in decimal form.
Discussion
Slope Formula
Example
Saving to Donate
LaShay wants to not only learn about making accessible features in public spaces, she wants to donate money to groups that do. She saves the money she will donate by depositing the same amount in her piggy bank daily.

She wants to know how much money is in the bank before breaking the cute little figure. She assumes the piggy bank had $12.50 after five days and $17.50 after seven days.
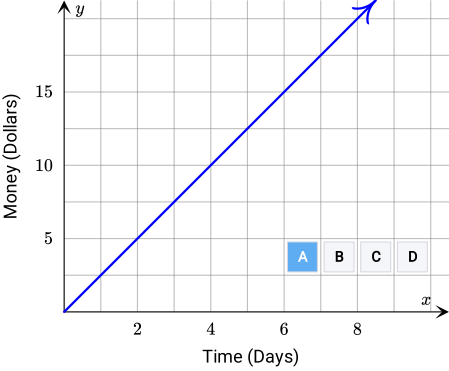
a Which one of the following graphs represents the money in the piggy bank versus time?
{"type":"choice","form":{"alts":["<span class=\"katex\"><span class=\"katex-html\" aria-hidden=\"true\"><span class=\"base\"><span class=\"strut\" style=\"height:0.7109375em;vertical-align:0em;\"><\/span><span class=\"mord text\"><span class=\"mord Roboto-Bold textbf\">A<\/span><\/span><\/span><\/span><\/span>","<span class=\"katex\"><span class=\"katex-html\" aria-hidden=\"true\"><span class=\"base\"><span class=\"strut\" style=\"height:0.7109375em;vertical-align:0em;\"><\/span><span class=\"mord text\"><span class=\"mord Roboto-Bold textbf\">B<\/span><\/span><\/span><\/span><\/span>","<span class=\"katex\"><span class=\"katex-html\" aria-hidden=\"true\"><span class=\"base\"><span class=\"strut\" style=\"height:0.73046875em;vertical-align:-0.009765625em;\"><\/span><span class=\"mord text\"><span class=\"mord Roboto-Bold textbf\">C<\/span><\/span><\/span><\/span><\/span>","<span class=\"katex\"><span class=\"katex-html\" aria-hidden=\"true\"><span class=\"base\"><span class=\"strut\" style=\"height:0.7109375em;vertical-align:0em;\"><\/span><span class=\"mord text\"><span class=\"mord Roboto-Bold textbf\">D<\/span><\/span><\/span><\/span><\/span>"],"noSort":true},"formTextBefore":"","formTextAfter":"","answer":0}
{"type":"text","form":{"type":"math","options":{"comparison":"1","nofractofloat":false,"keypad":{"simple":true,"useShortLog":false,"variables":["x"],"constants":["PI"]},"rendered":false},"text":"<span class=\"katex\"><span class=\"katex-html\" aria-hidden=\"true\"><\/span><\/span>"},"formTextBefore":"<span class=\"katex\"><span class=\"katex-html\" aria-hidden=\"true\"><span class=\"base\"><span class=\"strut\" style=\"height:0.43056em;vertical-align:0em;\"><\/span><span class=\"mord mathdefault\">m<\/span><span class=\"mspace\" style=\"margin-right:0.2777777777777778em;\"><\/span><span class=\"mrel\">=<\/span><\/span><\/span><\/span>","formTextAfter":null,"answer":{"text":["2.5"]}}
c If the amount LaShay wants to donate is $30, how many days will it take her to save that amount?
{"type":"text","form":{"type":"math","options":{"comparison":"1","nofractofloat":false,"keypad":{"simple":true,"useShortLog":false,"variables":["x"],"constants":["PI"]},"rendered":false},"text":"<span class=\"katex\"><span class=\"katex-html\" aria-hidden=\"true\"><\/span><\/span>"},"formTextBefore":null,"formTextAfter":"days","answer":{"text":["12"]}}
Hint
a Write the given information as ordered pairs. Plot those ordered pairs on the coordinate plane and draw a line passing through them.
b Use the slope formula.
c What does the slope mean in this context? How can it be used to find the number of days?
Solution
a Recall that LaShay saved $12.50 after five days and $17.50 after seven days. This information can be written as ordered pairs. The x-coordinates will be the time and the y-coordinates will be the money.
(5,12.5) and (7,17.5)
The line representing the relation between time and money passes through these points. Plot these points on the coordinate plane. Note that since time and money cannot be negative, only the first quadrant needs to be considered. 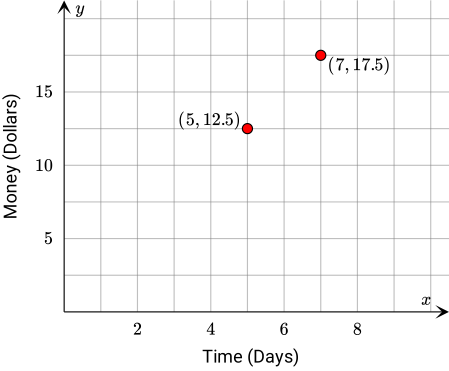
Now that there are two points on the plane, draw a line passing through them to obtain the line of the relation.
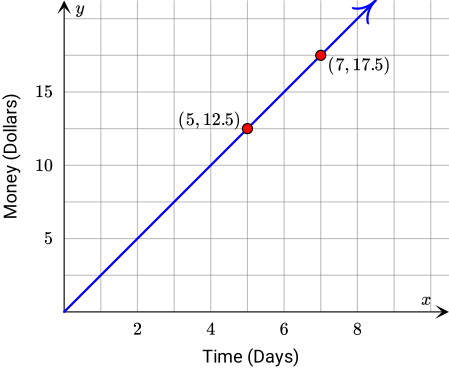
This graph matches the one given in option A. Therefore, graph A represents the relation.
b Since two points on the line are known, use the slope formula to find the slope of the relation.
m=x2−x1y2−y1
SubstitutePoints
Substitute (5,12.5) & (7,17.5)
m=7−517.5−12.5
SubTerms
Subtract terms
m=25
CalcQuot
Calculate quotient
m=2.5
c The slope of the line is 2.5, according to Part B. This means that LaShay deposits $2.50 into her piggy bank every day. If the amount that she wants to donate is $30, the amount of time it will take her to save enough can be found by dividing $30 by 2.5.
2.5dollars/day30dollars=12 days
It will take LaShay 12 days to save the $30 that she wants to donate if she puts $2.50 into her piggy bank every day.
Alternative Solution
Using the Slope to Find the TimeThe number of days required for LaShay to save $30 can also found by using the slope formula. The point (x,30), where x is the number of days and 30 is the price of the novel, will also lie on the line. The value of x can be found by using (5,12.5) for the second point. Remember, the slope of the line is 2.5.
This process shows that the amount of time it would take LaShay to save $30 is 12 days. That is not so bad at all!
2.5=x2−x1y2−y1
SubstitutePoints
Substitute (5,12.5) & (x,30)
2.5=x−530−12.5
SubTerms
Subtract terms
2.5=x−517.5
MultEqn
LHS⋅(x−5)=RHS⋅(x−5)
2.5(x−5)=17.5
Distr
Distribute 2.5
2.5x−12.5=17.5
AddEqn
LHS+12.5=RHS+12.5
2.5x=30
DivEqn
LHS/2.5=RHS/2.5
x=12
Pop Quiz
Finding the Slope of a Line Using the Slope Formula
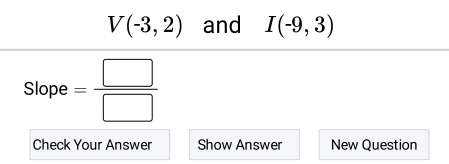
Find the slope of a line passing through the given points using the slope formula.
Closure
What is the Slope of the Wheelchair Ramp?
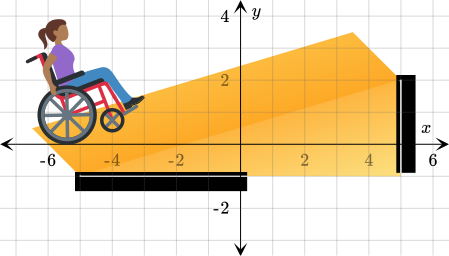
Throughout this lesson, the concept of rate of change and its relation to the concept of slope have been examined. The challenge presented at the beginning of the lesson can now be solved. Recall that at Jefferson High, a wheelchair ramp is being made for the front entrance. LaShay got a hold of the ramp's design displayed on a coordinate plane.
{"type":"choice","form":{"alts":["The slope is <span class=\"katex\"><span class=\"katex-html\" aria-hidden=\"true\"><span class=\"base\"><span class=\"strut\" style=\"height:0.64444em;vertical-align:0em;\"><\/span><span class=\"mord\">0<\/span><span class=\"mord\">.<\/span><span class=\"mord\">3<\/span><span class=\"mord\">.<\/span><\/span><\/span><\/span> It is not acceptable.","The slope is <span class=\"katex\"><span class=\"katex-html\" aria-hidden=\"true\"><span class=\"base\"><span class=\"strut\" style=\"height:0.64444em;vertical-align:0em;\"><\/span><span class=\"mord\">0<\/span><span class=\"mord\">.<\/span><span class=\"mord\">1<\/span><span class=\"mord\">3<\/span><span class=\"mord\">.<\/span><\/span><\/span><\/span> It is acceptable.","The slope is <span class=\"katex\"><span class=\"katex-html\" aria-hidden=\"true\"><span class=\"base\"><span class=\"strut\" style=\"height:0.64444em;vertical-align:0em;\"><\/span><span class=\"mord\">0<\/span><span class=\"mord\">.<\/span><span class=\"mord\">5<\/span><span class=\"mord\">3<\/span><span class=\"mord\">.<\/span><\/span><\/span><\/span> It is not acceptable.","The slope is <span class=\"katex\"><span class=\"katex-html\" aria-hidden=\"true\"><span class=\"base\"><span class=\"strut\" style=\"height:0.64444em;vertical-align:0em;\"><\/span><span class=\"mord\">0<\/span><span class=\"mord\">.<\/span><span class=\"mord\">2<\/span><span class=\"mord\">.<\/span><\/span><\/span><\/span> It is acceptable."],"noSort":false},"formTextBefore":"","formTextAfter":"","answer":0}
Hint
Choose two points on the same side of the ramp. Then use the slope formula to find the slope of the ramp.
Solution
Begin by choosing two points on the the same side of the ramp. Choosing points that lie directly on the lattice of the graph helps make the required calculations easier.
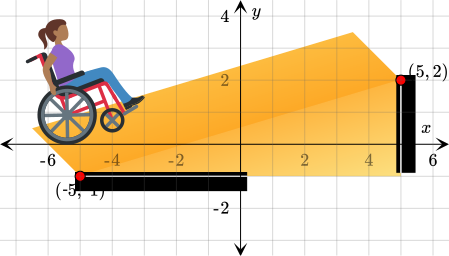
m=x2−x1y2−y1
SubstitutePoints
Substitute (-5,-1) & (5,2)
m=5−(-5)2−(-1)
NegNeg
-(-a)=a
m=5+52+1
AddTerms
Add terms
m=103
CalcQuot
Calculate quotient
m=0.3
Constant Rate of Change and Slope
Recommended exercises
To get personalized recommended exercises, please login first.
Loading content
Loading content