a Note that the phrase at most refers to less than or equal to.
B
b Note that the phrase at least refers to greater than or equal to.
A
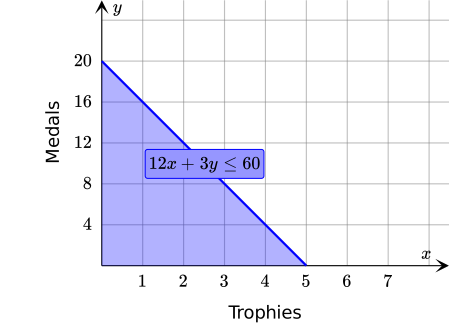
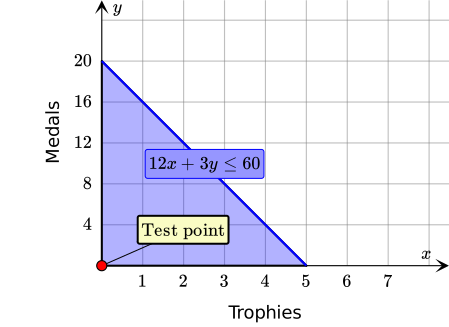
aInequality: 12x+3y≤ 60
Graph:
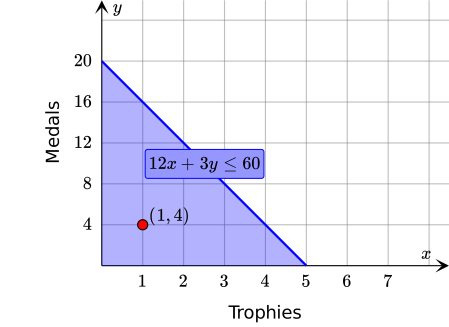
Example Solution: 1 trophy and 4 medals
B
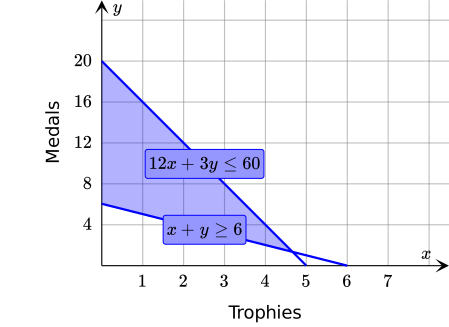
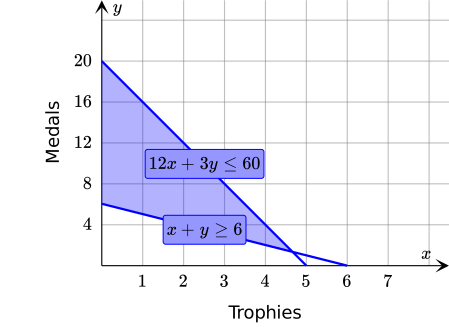
bSystem:12x+3y≤ 60 x+y≥ 6
Graph:
Example Solution: 2 trophies and 8 medals
Practice makes perfect
a We want to write and graph an inequality for the given situation. Let's recall the given information.
Cost Of One Trophy:& $ 12
Cost Of One Medal:& $3
Spending Limit:& $60
Let x be the number of trophies and let y be the number of medals. By using the given information, we will first write an inequality in an organized table.
Verbal Expression
Algebraic Expression
Cost of x trophies ($)
12 x
Cost of y medals ($)
3 y
Total cost ($)
12 x+ 3 y
Total cost is less than or equal to $60.
12 x+ 3 y≤ 60
Therefore, we have an inequality that represents the situation.
12 x+ 3 y≤ 60
Now, to graph the above inequality, we will determine its boundary line by replacing the inequality sign with the equals sign.
Inequality &Boundary Line
12x+3y ≤ 60 &12x+3y = 60
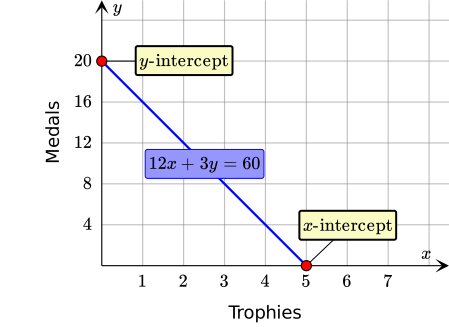
Then, we will draw the boundary line. Since the equation of the line is in standard form, we can draw it by finding its intercepts. To find the x-intercept, we substitute y=0 in the equation and solve it for x. We proceed in the same way to find the y-intercept, as well.
x-intercept
y-intercept
Substitution
Point
Substitution
Point
12x+3( 0)=60
(5,0)
12( 0)+3y = 60
(0,20)
Next, we will plot the intercepts and draw the boundary line that passes through these points. Note that the number of boxes cannot be negative, so the line will be restricted by the axes. Additionally, since the inequality is non-strict, the line will be solid.
Finally, we will decide which side of the line we should shade. We will choose a point either side of the line and substitute it into the inequality. If it satisfies the inequality, we shade the region that contains the point. Otherwise, we shade the other region. Let (0,0) be our test point!
The points with whole number coordinates in the shaded region are the solutions to the inequality.
Therefore, one possible solution can be 1 trophy and 4 medals.
b Since we want to buy at least 6 items, the total number of trophies and medals must be greater than or equal to 6. Let's use this information to write the inequality.
x+ y ≥ 6
With the inequality in Part A, we can write the system of inequalities.
12x+3y≤ 60 x+y≥ 6
Proceeding in the same way as we did in Part A, we can graph the system.
Since the overlapping area is the solution, one possible solution can be 2 trophies and 8 medals.