The number farthest to the left on the number line is the lowest.
Coldest Time: 3:00PM Time When the Temperature Is Closest to 0^(∘)C: 12:00PM
Practice makes perfect
We are given a table with temperatures recorded at the same location each hour for several hours. We want to know at what time is the temperature coldest and at what time is the temperature closest to the freezing point of water, 0^(∘)C. We will do these things one at a time.
Finding at What Time the Temperature Is Coldest
Let's start by looking at the given table!
Time
10:00AM
11:00AM
12:00PM
1:00PM
2:00PM
3:00PM
Temperature (^(∘) C)
- 2.6
- 2.7
- 0.15
1.6
- 1.25
- 3.4
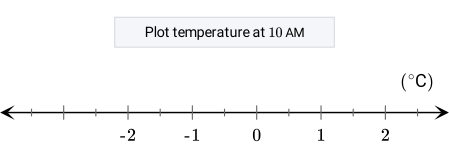
To find when the temperature is the coldest, we will start by plotting the values of all temperatures on the number line. Let's do it!
We can see on the diagram that - 3.4^(∘) C is farther to the left than - 2.6 ^(∘) C, - 2.7^(∘) C, - 1.25^(∘) C, - 0.15^(∘) C and 1.6^(∘) C. This means that - 3.4^(∘) C is the lowest temperature. Therefore, the coldest temperature is at 3:00PM.
Finding at What Time the Temperature Is Closest to the Freezing Point of Water
To find at what time the temperature is closest to the freezing point of water, we have to find the temperature closest to 0^(∘) C. We can start by recalling some facts about the absolute value.
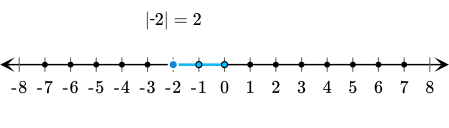
The absolute value of a number is its distance from 0 on the number line.
Since distance is always greater than or equal to 0, the absolute value of any number is greater than or equal to 0.
The absolute value of a non-negative number is equal to the number, while the absolute value of a negative number is equal to its opposite.
Let's consider the distances between different numbers and 0 on the number line.
To find the distance betwen each temperature and 0^(∘) C, we will calculate the absolute value of all temperatures. Let's do it!
Time
10:00AM
11:00AM
12:00PM
1:00PM
2:00PM
3:00PM
Temperature (^(∘) C)
- 2.6
- 2.7
- 0.15
1.6
- 1.25
- 3.4
Distance from 0^(∘) C
|- 2.6|= 2.6
|- 2.7|= 2.7
|- 0.15|= 0.15
|1.6|= 1.6
|- 1.25|= 1.25
|- 3.4|=3.4
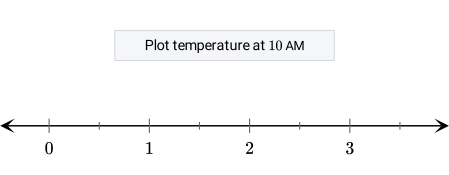
Now, we can plot the distances on a number line to see the order from least to greatest.
We can see on the diagram that |- 0.15^(∘)C| is farthest to the left, so - 0.15^(∘)C is the lowest. This means that temperature is closest to the freezing point of water, 0^(∘)C, at 12:00PM.