Sign In
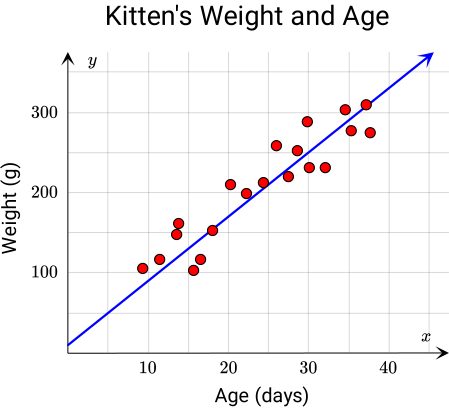
The scatter plot above shows the mean weights of kittens from the same litter in relation to their age. In this case, a line of fit could be drawn quite seamlessly. When drawing a line of fit, the following characteristics should be considered.
Ultimately, a line of fit can be used to make predictions and generalize the trends of data sets. Additionally, when a line of fit is determined using strict mathematical methods, it is commonly referred to as a line of best fit.