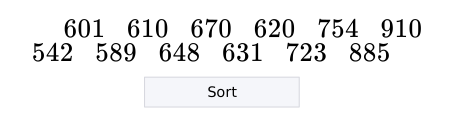
To find the five-number summary, first write the data from least to greatest.
Minimum: 542 First Quartile: 605.5 Median: 639.5 Third Quartile: 738.5 Maximum: 910
Practice makes perfect
We are asked to find the five-number summary of the data about the customers from a previous exercise.
Week
Customers
1
542
2
601
3
589
4
610
5
648
6
670
7
631
8
620
9
723
10
754
11
885
12
910
A five-number summary consists of the minimum value, the first quartile, the median, third quartile, and the maximum value. Let's look at the customer number values in our data.
We will start by sorting the values from least to greatest.
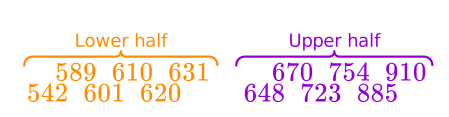
Now that the data is in increasing order, we can identify the median, or the middle value of the data set. Let's split the set into two equal parts.
Since we have an even number of data points, there are two middle values in this data set.
The median of the data set is the mean of these values, 631 and 648.
The median of the data set is 639.5. Next, let's find the quartiles. The first quartile is the median of the lower half and the third quartile is the median of the upper half of the values.
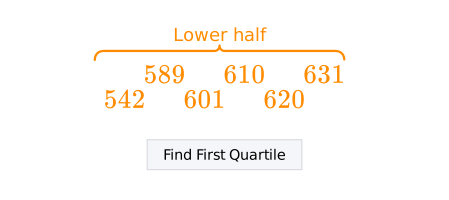
Let's find the first quartile!
There are two middle values in the lower half, 601 and 610. Let's find their average to find the first quartile.
Q1=601+ 610/2= 605.5
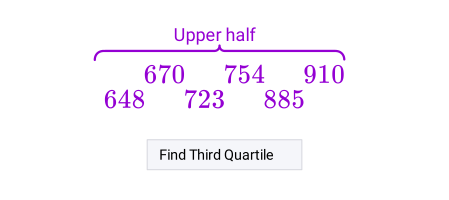
Now let's find the third quartile.
The third quartile is the average of 723 and 754. Let's find it.
Q3=723+ 754/2=738.5
Finally, let's find the minimum and maximum values of the data set.
We can see that the maximum number of customers is equal to 910 and the minimum number of customers is equal to 542. We found all the numbers needed to make the five-number summary!