c Which of the remaining graphs reflect a starting point of (1,0.75)?
A
a Graph 3
B
b Graph 2
C
c Graph 4
Practice makes perfect
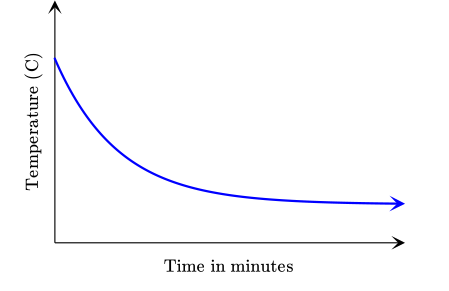
a The graph describes the temperature of boiling water that is cooling down. As time passes, the temperature decrease. Therefore, time must be the independent variable and temperature is the dependent variable.
Additionally, cooling down suggests that the temperature is decreasing. The only diagram that shows a decreasing graph is Graph 3.
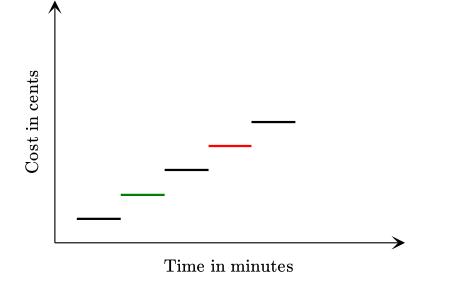
b There are two pairs of points in our table of values that tells us what kind of graph this is.
& l
↓ ↓ ↓ ↓
& |l|c|c|c|c|c|c|c|c|
-3pt Time (min) -3pt & -3pt 1 -3pt & -3pt 2 -3pt & -3pt 2.5 -3pt & -3pt 3 -3pt & -3pt 4 -3pt & -3pt 5 -3pt & -3pt 5.3 -3pt & -3pt 6 -3pt
-3pt Cost (cents) -3pt & -3pt 55 -3pt & -3pt 75 -3pt & -3pt 75 -3pt & -3pt 95 -3pt & -3pt 115 -3pt & -3pt 135 -3pt & -3pt 135 -3pt & -3pt 155 -3pt
Notice that the cost is the same for 2 and 2.5 minutes. The cost is also the same for 5 and 5.3 minutes. Therefore, the corresponding function is a step function. The only diagram that fits this description is Graph 2.
c The length of the baby depends on the number of months it's been in the womb. Therefore, age must be the independent variable and length the dependent variable.
Having excluded graph 2 and graph 3, we turn our attention to the remaining graphs. Notice that the table of values starts at an age of 1 month. Therefore, the baby should already be of a certain size at this time. This automatically exclude Graph 1 and Graph 5 as these does not start at (1,0.75). Therefore, the correct graph is Graph 4.