One method is by using the point and slope that we can identify from the point-slope form.
See solution.
Practice makes perfect
Let's recall the point-slope form of a linear function.
y- y_1= m(x- x_1)
Here m is the slope and ( x_1, y_1) is a point on the line. We will now explore two methods to graph a line given in point-slope form.
First Method
First we need to identify the slope and the point in the given function.
y- y_1&= m(x- x_1) [0.8em]
y- 1&= 3/2(x- 4)
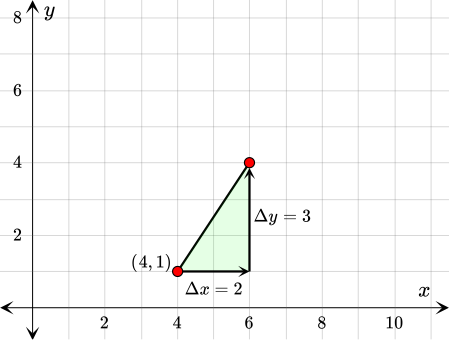
We identified the point ( 4, 1) and a slope of 32. Recall that the slope is the change in y divided by the change in x.
m= 3/2
⇓
Δ y/Δ x= 3/2
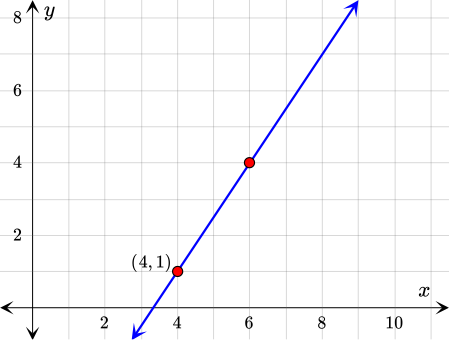
We will now first plot the point ( 4, 1). Then we will, as indicated by the slope, take a step of 2 units to the right and 3 units up to find a second point.
By drawing a line through the points we have our graph.
Second Method
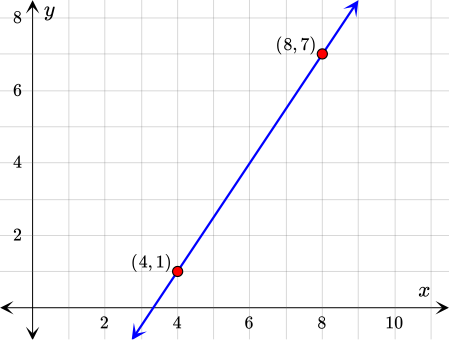
The second method is to use the given equation to find a second point. This is done by substituting an arbitrary y- or x-coordinate into the equation and solving for the other variable. Let's substitute x= 8 and solve for y.