Each region of a plane represents outcomes. Which of the colored regions has the largest area?
20 points
Practice makes perfect
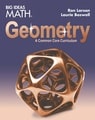
We are throwing a dart at a square board with sections that are worth either 5, 10, or 20 points. Any given spot on the board is equally likely to be hit. We want to determine which number of points we are most likely to hit. Consider the given diagram.
Each region of a plane represents outcomes. Therefore, we will decide which of the colored regions has the largest area — red, yellow or blue. Notice each of these figures is a square or is a part of a different square. From the given diagram, we can compare the side lengths of each square.
Red: & 2 in
Yellow: & 4 in = 2+2 in
Blue: & 6 in = 4+2 in
Since the side length of the red square is half the side length of the yellow square and one third the side length of the blue square, we can divide the squares into smaller squares. The cross hatch diagram below shows how we can break it down.
Each of the smaller squares has a side length of 2 inches. Therefore, they are congruent. Let's compare the number of small squares for each of the colored regions.
Red: & 1 square
Yellow: & 3 squares
Blue: & 5 squares
We can use the Probability Formula to find the probability of landing on any of the point values. The favorable number of outcomes is the number of squares represented by that color and the total outcomes is the total number of squares. The higher the probability, the more likely we are to hit that number of points.
Probability Formula
Substitution
5 Points
P(5Points)=number of red squares/number of squares on the board
P(5Points)=1/9
10 Points
P(10Points)=number of yellow squares/number of squares on the board
P(10Points)=3/9
20 Points
P(20Points)=number of blue squares/number of squares on the board
P(20Points)=5/9
Since there are 5 blue squares, the probability of getting 20 points is the highest. Therefore, we are the most likely to get 20 points.