4. What is Statistics
Sign In
An error ocurred, try again later!
Chapter 12
4.
What is Statistics
Statistics is the study of collecting, analyzing, and interpreting data. It involves asking statistical questions and gathering information through various sampling methods. Understanding how to choose between different types of samples, such as simple random, systematic, convenience, and voluntary response samples, helps in gathering reliable data. Making valid inferences is the next crucial step, ensuring that conclusions drawn from data accurately reflect the population being studied. These concepts are important in many fields, such as research, business, and government, where data-driven decisions are needed. Understanding statistics enables better decision-making by providing insight into trends, patterns, and relationships within data, making it a powerful tool for informed choices.
Show less Show more expand_more 


Lesson Settings & Tools
| | 18 Theory slides |
| | 8 Exercises - Grade E - A |
| | Each lesson is meant to take 1-2 classroom sessions |
What is Statistics
Slide of 18
Data is crucial in understanding many facets of life such as people's opinions, preferences and predicting future weather conditions. Statistics play a vital role in every stage of data analysis — ranging from collecting reliable data to drawing meaningful conclusions. This lesson aims to provide an overview of statistics.
Catch-Up and Review
Here are a few recommended readings before getting started with this lesson.
Challenge
Are Five-Star Ratings Reliable?
Dylan is fascinated with statistics. He learns that data is constantly collected about people, both voluntarily and not so much. Data allows companies to understand and make predictions about customers. One widespread form of data collection is when apps post messages asking for five-star rankings.
 These messages are insistent and interrupt customers while using the app. Most people who respond tend to rate the app as one star or five stars, rarely anything in between. Are conclusions gathered from such rankings reliable? Why is that the case?
Discussion
Statistics and Statistical Questions
Statistics is a set of tools and techniques used to collect, organize, and interpret information. These pieces of information are also known as data, which statisticians analyze.
 One of the main ways to collect data consist of asking questions. There are especially useful questions that are known as statistical questions.
Concept
Statistical Question
A question is considered a statistical question when it is designed to anticipate and account for a variety of answers. Consider the differences between the following statistical and non-statistical questions.
| Non-statistical Question | Statistical Question |
|---|---|
| What is Davontay's height? | What are the heights of the students in Davontay's class? |
| What is the total population of the United States? | In the United States, what is each individual state's population? |
| What was Paulina's last Pre-Algebra test score? | What are Paulina's test scores from previous month? |
Discussion
Asking Questions to Gather Data
Data is gathered with the goal of interpreting it into meaningful information. Asking a set of questions to gather this data — usually statistical questions — leads to a clearer picture when interpreting the data. Such sets of questions are called surveys.
Concept
Survey
A statistical study that collects data from participants through a questionnaire — a series of questions — is called a survey.The answers obtained in a survey aim to collect data about the characteristics, behaviors, or opinions of the members of the population.

Questions must be clear to avoid confusion in the participant. The participants answer the questions while the researcher is sure to never interfere. Here are a few common types of surveys.
- Online: This is one of the most cost effective ways to conduct a survey. Individuals are able to respond quickly as they can do them via a website or through email.
- Phone Call: This method requires interviewing participants through phone calls. It could require more time and money than online surveys because of service costs and number of calls made.
- Face-to-face: The researcher conducts the survey in-person with the participant. This choice could be expensive and time-consuming.
Discussion
What is the Goal of Statistics?
Statistics are used to analyze collected data to help understand how different things work or how different people think. The goal of statistics is to understand the characteristics of a population.
Concept
Population
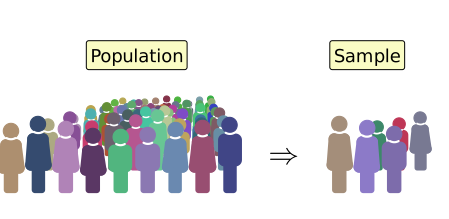
In statistics, a population consists of all members of a group of interest. Populations can vary in size and include people, animals, plants, or objects. Since studying every member of a population is impractical, a representative subset called a sample is used instead. The sample is used to represent or make assumptions about the population.
Example
Identifying the Population and the Sample
Dylan is hyped to learn more about statistics but he is having some issues. He cannot determine which set represents the population and which represents a sample of the population. Dylan goes to his teacher for help.

She gives Dylan a few example problems that will help him learn about sample versus population.
a Pair the following.
{"type":"pair","form":{"alts":[[{"id":0,"text":"The students of Dylan's school"},{"id":1,"text":"Dylan's classmates"}],[{"id":0,"text":"Population"},{"id":1,"text":"Sample"}]],"lockLeft":false,"lockRight":false},"formTextBefore":"","formTextAfter":"","answer":[[0,1],[0,1]]}
b Pair the following.
{"type":"pair","form":{"alts":[[{"id":0,"text":"The inhabitants of a city"},{"id":1,"text":"Workers of the local city mall"}],[{"id":0,"text":"Population"},{"id":1,"text":"Sample"}]],"lockLeft":false,"lockRight":false},"formTextBefore":"","formTextAfter":"","answer":[[0,1],[0,1]]}
c Pair the following.
{"type":"pair","form":{"alts":[[{"id":0,"text":"Members of a league"},{"id":1,"text":"Members of a team"}],[{"id":0,"text":"Population"},{"id":1,"text":"Sample"}]],"lockLeft":false,"lockRight":false},"formTextBefore":"","formTextAfter":"","answer":[[0,1],[0,1]]}
Hint
a The sample is always taken from the population.
b The sample is always taken from the population.
c The sample is always taken from the population.
Solution
a Since the sample is always part of the population, identifying the larger group determines which of the sets represents the population. In this case, Dylan's classroom is part of the students of his school.
The Students of Dylan’s SchoolDylan’s Classmates→→PopulationSample
b Similar to what was done in Part A, it is important to determine which set is part of the other. In this case, the workers at the local City Mall are inhabitants of that city and not the other way. Therefore, the population is the set of the city's inhabitants.
The Inhabitants of a cityWorkers of the local city mall→→PopulationSample
c Finally, a league is made of several teams. Therefore, the members of a team are a sample of all the members of a league.
The members of a leaugeThe members of a team→→PopulationSample
Example
How Many Games With More Than 30 Points?
Dylan's loves playing basketball.
 A reason for Dylan's interest in statistics is that he wants to understand the stats of his favorite players over the course of a season. He decides to try out some statistics for practice and notes the scores of his favorite player, Savant Saucey, in games selected at random during the season.
| Scores | |
|---|---|
| 45 | 27 |
| 40 | 33 |
| 22 | 46 |
| 29 | 9 |
| 18 | 20 |
| 34 | 15 |
a Help Dylan find the probability that his Savant Saucey scores 30 or more points during a game. Write the answer as a fraction.
{"type":"text","form":{"type":"math","options":{"comparison":"1","nofractofloat":false,"keypad":{"simple":true,"useShortLog":false,"variables":["x"],"constants":["PI"]},"rendered":false},"text":"<span class=\"katex\"><span class=\"katex-html\" aria-hidden=\"true\"><\/span><\/span>"},"formTextBefore":null,"formTextAfter":null,"answer":{"text":["\\dfrac{5}{12}"]}}
b Savant Saucey will play in about 60 games during the season. Use an equivalent ratio to help Dylan predict how many of these games his favorite player will score more than 30 points. Round to the nearest whole number.
{"type":"text","form":{"type":"math","options":{"comparison":"1","nofractofloat":false,"keypad":{"simple":true,"useShortLog":false,"variables":["x"],"constants":["PI"]},"rendered":false},"text":"<span class=\"katex\"><span class=\"katex-html\" aria-hidden=\"true\"><\/span><\/span>"},"formTextBefore":null,"formTextAfter":null,"answer":{"text":["25"]}}
Hint
a The probability is found by dividing the number of games with more than 30 points by the total number of games in the sample.
b Write an equivalent ratio by dividing the number of estimated games with more than 30 points by the total number of games.
Solution
a The probability that Dylan's favorite player scores 30 points or more during a game is obtained by dividing the number of games in which the player scored more than 30 points by the number of games.
p=Total number of gamesGames with score ≥30
This number of games can be identified by noting the number of times the score is 30 or higher in the table. | Scores | |
|---|---|
| 45 | 27 |
| 40 | 33 |
| 22 | 46 |
| 29 | 9 |
| 18 | 20 |
| 34 | 15 |
p=125
b Two ratios are equivalent if they result in the same value. Let g be the predicted number of games where Dylan's favorite player scores more than 30 points. The probability 125 has to be equal to g divided by the total number of games 60 to write an equivalent ratio for the prediction.
125=60g
The fraction on the left-hand side of the equation can be rewritten to find the value of g. First, notice that multiplying 12 by 5 results in 60. For the ratios to be equivalent, then 5 multiplied by 5 has to be equal to g.
125=60g
ExpandFrac
ba=b⋅5a⋅5
6025=60g
MultEqn
LHS⋅60=RHS⋅60
25=g
RearrangeEqn
Rearrange equation
g=25
Example
Getting Buckets
Most shots in basketball are worth two points. However, there are other shots with different values. For example, a free throw is worth one point. These are uncontested shot attempts that players are awarded if they are fouled while shooting.

a Dylan's favorite player, Savant Saucey is a certified bucket getter. Saucey was successful on 92% of their free throw attempts during the season. If Saucey attempted 300 free throws, how many did they make?
{"type":"text","form":{"type":"math","options":{"comparison":"1","nofractofloat":false,"keypad":{"simple":true,"useShortLog":false,"variables":["x"],"constants":["PI"]},"rendered":false},"text":"<span class=\"katex\"><span class=\"katex-html\" aria-hidden=\"true\"><\/span><\/span>"},"formTextBefore":null,"formTextAfter":"free throws","answer":{"text":["276"]}}
b In addition to free throws, there are shots that are worth three points called three pointers. They are taken from about 23 feet or further from the basket. Savant Saucey was successful on 42% of 750 attempted three pointers. How many points did Savant score from three pointers? Round to the nearest integer.
{"type":"text","form":{"type":"math","options":{"comparison":"1","nofractofloat":false,"keypad":{"simple":true,"useShortLog":false,"variables":["x"],"constants":["PI"]},"rendered":false},"text":"<span class=\"katex\"><span class=\"katex-html\" aria-hidden=\"true\"><\/span><\/span>"},"formTextBefore":null,"formTextAfter":"points","answer":{"text":["945"]}}
Hint
a Find the 92% of 300 by multiplying.
b Find the 42% of 750 by multiplying.
Solution
a The probability that Savant Saucey makes a free throw is 92%. Since they took 300 attempts, the amount of successful makes is a result of finding 92% of 300. This percent is obtained by multiplying 300 by 10092=0.92.
0.92⋅300=276
This means that, of the 300 attemps Savant Saucey took, they were successful on 272. That is outstanding.
b This part is solved similarly to how Part A was solved. Since Savant Saucey took 750 three-point shot attempts, the number of successful shots is the result of finding the 42% of 750. This is done by multiplying.
0.42⋅750=315
This means that Savant Saucy was successful on 315 three point shots. Then, since each shot is worth three points, the total number of points is found by multiplying 315 by 3. 315⋅3=945
Savant Saucey scored 945 points in the season just from three point shots. That is very good!
Discussion
Selecting a Sample
A key point in selecting a sample is to select a sample that most reflects the population. These samples are called representative samples and help produce meaningful interpretations.
Concept
Representative Sample
A sample that accurately reflects the characteristics of the population is called a representative sample.
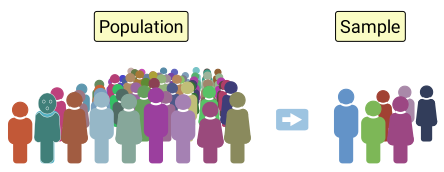
In a representative sample, if x parts of the population have a certain characteristic, approximately x parts of the sample will share the same characteristic. As an example, consider a sample of cats and dogs selected from all the cats and dogs at a pet shop.
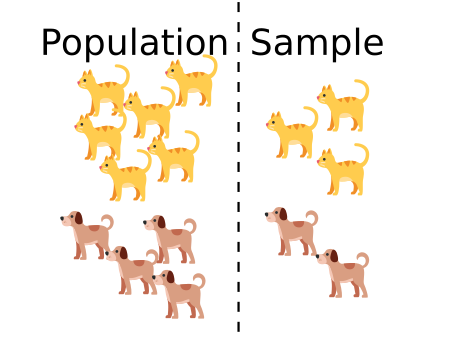
The figure shows cats represent 60% of the population and 60% of the sample. Similarly, dogs represent 40% of the population and 40% of the sample. In this case, the sample is then representative. Note that in a representative sample, every subgroup of the population is represented.
Extra
Relation with BiasIt is possible that samples reflect biases. In most cases, unbiased samples result in representative samples. On the other hand, biased samples usually result in samples that are not representative of the population.
Discussion
Unbiased Samples
A sample is said to be unbiased if every member of the population has the same probability of being selected. The most common of these types are called Simple Random Samples.
Concept
Simple Random Sample
In a simple random sample, each member of a population is equally likely to be selected as part of the sample. Consider an example where a researcher performs the following procedure.
 To generate a simple random sample, each member of a population can be assigned a unique ID — for example, a whole number. Then, a random number generator can be used to generate IDs until the desired sample size is satisfied.
There are 20 people, each assigned a unique number,who are surveyed. Of those 20 people, 4 need tobe randomly selected as a sample. The researcher writes each unique number on a paper and placesthem in a bag.The researcher then blindly selects4 papers out of the bag.
The researcher's way of choosing a sample means that each participant is equally likely to be selected as part of the sample. The following applet shows a generated example of simple random samples.
Extra
Biased or Unbiased SamplingA simple random sample is an unbiased sample because it involves selecting members from a population randomly, guaranteeing that each member of the population has an equal chance of being included. This is usually representative as it tends to have the same characteristics as the population.
Unbiased Sampling: Biased Sampling: Members of a population are selected randomly. Members of a population are hand chosen, for example.
An example of biased surveying would be a coach who asks only their favorite players about the effectiveness of their team's strategy. Just imagine if only the stars of the team are allowed to give their opinion to the coach. However, other instances might call for biased sampling such as a study about how Olympic athletes perform under pressure.
Discussion
Systematic Samples
Another unbiased sample type is a systematic sample.
Concept
Systematic Sample
In a systematic sample, the members of a population are ordered randomly or in a random-like way. The sample size is predetermined and selected among the members in a specified interval. The intervals are determined by dividing the population size by the sample size. Consider an example.
 A systematic sample is often used when a complete list of the population is available. Different samples can be created by varying the starting point when using systematic sampling. This gives the surveyors the ability to check if the conclusions hold across the samples.
Five customers are surveyed aboutthe quality of a fragrance shampoo.
A sample of 5 people is selected from a population of 20 people using systematic sampling.
Extra
Biased or Unbiased SamplingSystematic samples can be either biased or unbiased.
Biased: Unbiased: If the initial order of the population is biased,the sample will also be biased.If the members of the population are orderedrandomly without a cyclic pattern, it isexpected that the systematic samplingwill also be unbiased.
An example of a bias would be if the population is arranged in a cyclical pattern that matches the sampling interval. That can lead to a group being preferred over other groups, which leads to bias in the sample. It is important to remember that unbiased samples are better suited to generate a representative sample.
Discussion
Biased Samples
In biased samples, one part of the population is preferred over the others in some way. These type of samples are usually not representative samples, but are usually more practical than unbiased samples. For example, consider convenience samples.
Concept
Convenience Sample
In a convenience sample, members of a population are selected to be in a sample based on convenience or their availability to the researchers. Consider an example.
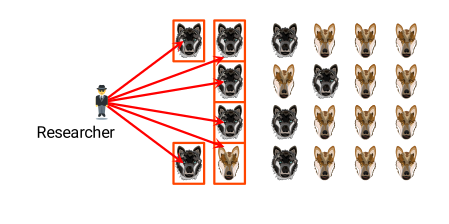
A researcher wants to study all wolf subspeciesin a forest. However, they only have the fundsto study those that frequently visit a certain area.
This is an example of convenience sampling because the researcher is selecting wolves who are conveniently available and in close proximity. This type of sampling is often used when researchers have limited resources or are under certain time constraints.
Extra
Biased or Unbiased SamplingConvenience sampling can lead to a biased sample since the researchers choose sample members that are easily available to them. Some groups of people in the population may not be represented in the sample because they are not easily accessible, causing the sample to not be representative of the population.
Discussion
Voluntary Response Sample
In a self-selected sample, the members of the sample are the people who are willing to participate. Since people participate voluntarily in these samples, the samples are also called voluntary response samples. Consider an example.
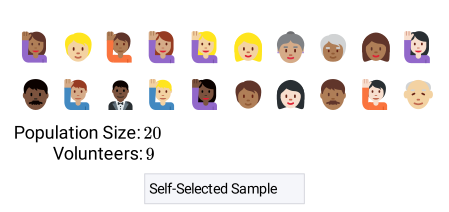
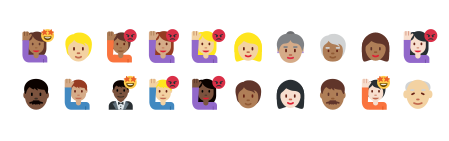
A survey about internet shopping is posted online.People volunteer to participate or simply ignore it.
The following applet shows a certain number of people who volunteer to participate in the survey.
Extra
Biased or Unbiased SamplingA self-selected sample is a biased sample because people with strong opinions, either positive or negative, about the topic studied are more likely to volunteer. Also, people who are interested in the topic being studied may be more likely to participate, while those who are not interested may refuse to participate.
As a result, such a sample is not representative of the population because it underrepresents people with neutral opinions about the topic or who are not interested in it.
Discussion
Making Inferences With the Results of a Survey
As previously mentioned in the lesson, one of the main goal of statistics is to make inferences about the characteristics of a population using samples. It is important to have in mind that not every inference is correct. However, valid inferences are very likely to be correct.
Concept
Valid Inference
A valid inference is a conclusion drawn from a sampling of a population that is highly likely to be true. This type of inference is based on representative samples and supported by sufficient data. Consider an example where a survey was conducted on the people of a city asking for their heights.

The survey was conducted in a simple random sampleof 250 inhabitants of a city. It found that the averageheight of the people in the sample is 5 feet 7 inches.
This is enough information to make an inference about the average height of all inhabitants of the city.
The average height of all inhabitants of the city is about 5′7.
This inference is valid because of the following characteristics of the study. - A simple random sample is usually unbiased.
- The number of participants 250 is a relevant sample size.
Example
How Many Students at School Like Basketball?
Dylan is doing great in statistics class. Miss Jackson assigns him to take another survey of his choice. Wondering if the students in his school like basketball as much as him, he decides to ask in a survey. He is nervous his classmates will say things like Basketball?
No way!
and Eww.

Dylan arrives to school early and asks every fifth student entering the school what their interest level is, if any, in basketball. By the end of the morning, Dylan surveyed 54 students. The results showed that almost 30% of the students love basketball!
a Select which type of sample Dylan selected to take the survey.
{"type":"choice","form":{"alts":["Systematic Sample","Simple Random Sample","Convenience Sample","Voluntary Response Sample"],"noSort":false},"formTextBefore":"","formTextAfter":"","answer":0}
b Is the conclusion a valid inference? Consider that there are about 500 students in Dylan's school.
{"type":"choice","form":{"alts":["Yes","No"],"noSort":false},"formTextBefore":"","formTextAfter":"","answer":0}
Hint
a Remember how each type of sample is taken.
b Is the sample biased? Did Dylan gather enough data?
Solution
a Dylan selected a sample by asking every fifth student. This method can be compared with each type of sample to verify which is the one that Dylan used.
| Sample | Characteristics |
|---|---|
| Simple random sample | The participants are selected from the population using an identifier. Every member has the same chance of being selected. |
| Systematic sample | The members of the population are ordered randomly. Then, each participant is selected in a specified interval. |
| Convenience sample | Each participant is selected based on availability or convenience to the researcher. |
| Voluntary response sample | Each participant voluntarily chooses to be a part of the sample. |
The order in which the students arrive to school is close to random. In addition to this, Dylan selected the participants in an interval of five. Therefore, it can be determined that Dylan chose a systematic sample.
b Since the order in which students arrive is random, every student has the same chance of being selected. This makes for an unbiased sample. Dylan also selected a sample of 54 students. This sample can compared to 10% of the number of students of the school.
10% of 500=50
Since 54 is a little more than 10% of the population, the sample is big enough. These characteristics make valid inferences. Therefore the answer is yes. Example
Favorite Basketball Team
Dylan is going to a game of his favorite basketball team, the Fighters.

There are three different teams in the state where Dylan lives. Wondering which team is the most popular in the state, Dylan conducted a survey on the day of the game. He asked several people in the Fighter's arena which was their favorite team from the state. Dylan's results can be represented with a pie chart.

a Select which type of sample Dylan selected to take the survey.
{"type":"choice","form":{"alts":["Systematic Sample","Simple Random Sample","Convenience Sample","Voluntary Response Sample"],"noSort":false},"formTextBefore":"","formTextAfter":"","answer":2}
b Is the conclusion a valid inference?
{"type":"choice","form":{"alts":["Yes","No"],"noSort":false},"formTextBefore":"","formTextAfter":"","answer":1}
Hint
a Remember how each type of sample is taken.
b Is the sample biased? Did Dylan gather enough data?
Solution
a Dylan selected a sample by asking people in the same arena as him, the Fighters arena. This method can be compared with each type of sample to verify which is the one that Dylan used.
| Sample | Characteristics |
|---|---|
| Simple random sample | The participants are selected from the population using an identifier. Every member has the same chance of being selected. |
| Systematic sample | The members of the population are ordered randomly. Then, each participant is selected in a specified interval. |
| Convenience sample | Each participant is selected based on availability or convenience to the researcher. |
| Voluntary response sample | Each participant voluntarily chooses to be a part of the sample. |
Dylan selected the participants of the sample in the same location as him. Therefore, it can be determined that Dylan chose a convenience sample.
b Dylan wants to know how popular are the Fighters in the state. However, most people that attend the Fighters arena will be Fighters fans. This makes a biased sample. Therefore, the answer is no.
Example
Ordering Jerseys
Dylan's uncle sells Fighters' jerseys at an apparel store. He knows that many people buy jerseys during the playoffs. He wants to know which he should order based on popularity. He randomly selected a simple random sample of 84 customers and conducted a survey asking who their favorite player is. The results are in the table.
| Player | Votes from Customers |
|---|---|
| Savant Saucey | 42 |
| Elgin Baylor | 25 |
| Nate Thurmond | 17 |
Dylan's uncle wants to order 420 new jerseys to sell during the playoffs. He already made a great table and now he asks Dylan to run some analysis that will help him make the correct order of jerseys.
a Do the results from Dylan's uncle's survey can make a valid inference?
{"type":"choice","form":{"alts":["Yes","No"],"noSort":false},"formTextBefore":"","formTextAfter":"","answer":0}
b How many jerseys from Savant Saucey should be ordered based on the results from the survey?
{"type":"text","form":{"type":"math","options":{"comparison":"1","nofractofloat":false,"keypad":{"simple":true,"useShortLog":false,"variables":["x"],"constants":["PI"]},"rendered":false},"text":"<span class=\"katex\"><span class=\"katex-html\" aria-hidden=\"true\"><\/span><\/span>"},"formTextBefore":null,"formTextAfter":"jerseys","answer":{"text":["210"]}}
Hint
Solution
a Every member of the population of customers has the same probability of being selected on a simple random sample. Therefore, the survey is not biased. Since the sample is not biased and was conducted on enough people, the survey can make a valid inference.
b The proportion of people who prefer Savant Saucey is needed before determining how many jerseys to order. This proportion can be found by dividing the customers that prefer this player by the total number of customers surveyed. The total number of customers surveyed can be obtained by adding the votes for each player.
42+25+17=84
The proportion needed is the same as the probability that Savant Saucey is the favorite player of a customer. Since the total number of people surveyed is 84, there is enough information to find this probability.
p=Number of people surveyedNumber of favorable outcomes
SubstituteValues
Substitute values
p=8442
ReduceFrac
ba=b/42a/42
p=21
CalcQuot
Calculate quotient
p=0.5
0.5⋅420=210
Therefore, 210 jerseys of Savant Saucey should be ordered. Closure
Are Five Star Ratings Biased?
Refer to the challenge given at the beginning of the lesson. Apps often ask customers to give five star reviews. The customers are the population that the app owners want to make inferences about. The method that the app owners use to select a sample can be determined by comparing it the following sample types.
| Sample | Characteristics |
|---|---|
| Simple random sample | The participants are selected from the population using an identifier. Every member has the same chance of being selected. |
| Systematic sample | The members of the population are ordered randomly. Then, each participant is selected in a specified interval. |
| Convenience sample | Each participant is selected based on availability or convenience to the researcher. |
| Voluntary response sample | Each participant voluntarily chooses to be a part of the sample. |
Zosia bought a big bag of marbles of different colors.
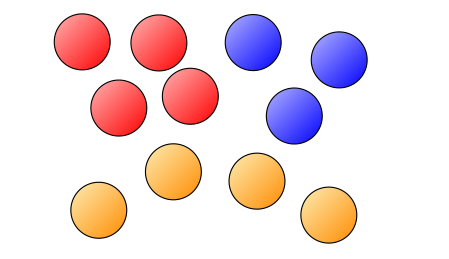
The bag contains 28 red marbles, 35 yellow marbles, and 21 blue marbles. Zosia wants to take a representative sample of these marbles. The sample has 4 red marbles.
{"type":"text","form":{"type":"math","options":{"comparison":"1","nofractofloat":false,"keypad":{"simple":true,"useShortLog":false,"variables":["x"],"constants":["PI"]},"rendered":false},"text":"<span class=\"katex\"><span class=\"katex-html\" aria-hidden=\"true\"><\/span><\/span>"},"formTextBefore":null,"formTextAfter":"yellow marbles","answer":{"text":["5"]}}
{"type":"text","form":{"type":"math","options":{"comparison":"1","nofractofloat":false,"keypad":{"simple":true,"useShortLog":false,"variables":["x"],"constants":["PI"]},"rendered":false},"text":"<span class=\"katex\"><span class=\"katex-html\" aria-hidden=\"true\"><\/span><\/span>"},"formTextBefore":null,"formTextAfter":"blue marbles","answer":{"text":["3"]}}
security
report
code
security
report
code
Zosia wants to select a representative sample from the marbles in the bag. A representative sample mostly resembles the characteristics of the population. In this case, there are three different colors of marbles. Red Marbles: & 28 Yellow Marbles: & 35 Blue Marbles: & 21 The sample has 4 red marbles. For the sample to share the same characteristics as the population, the ratio between each color of marble must be equivalent in both the population and the sample. This means that 4 divided by 28 should equal the ratio of the number of yellow marbles in the sample to 35. Let x be the number of yellow marbles in the sample.
For the sample to be representative, it should have 5 yellow marbles.
The number of blue marbles is found in a similar way. Let y be the number of blue marbles. Since the sample should have the same ratio of every type of marble, the division of 4 by 28 should be the same as the division of y by 21.
Therefore, the sample should contain 3 blue marbles.
security
report
code
What is Statistics
Recommended exercises
To get personalized recommended exercises, please login first.
Loading content
≤
>
■2
■▢
e▢
7
8
9
×
÷■1
=
=
√▢
▢√
∫▢▢
4
5
6
+
−
≤
<
log
ln
log▢
1
2
3
()
∣
sin
cos
tan
0
.
π
x
y
Loading content