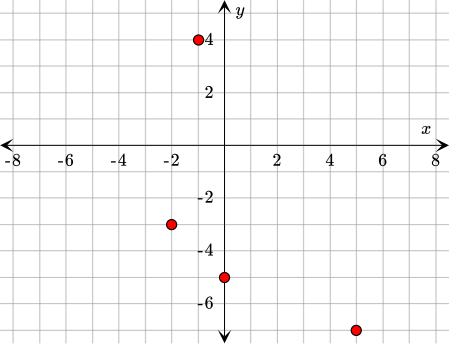
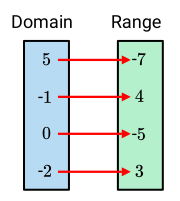
The first number in each pair is the x-value, and the second number is the corresponding y-value.
Table:
x
y
5
- 7
- 1
4
0
- 5
- 2
3
Graph:
Mapping
Domain: {-2, -1, 0, 5} Range: {- 7, -5, 3, 4}
Practice makes perfect
To express the set of given ( x, y) ordered pairs in a table, we will list all of the x-values in one column and all of the y-values in another column.
x
y
5
- 7
- 1
4
0
- 5
- 2
3
Now, to graph the ordered pair ( x, y), we will start by identifying the x- and y-coordinates on the axes. Then, we will trace along the grid lines to the point on which both coordinates lie. We will do this for every ordered pair in the relation.
To show the relation of ordered pairs ( x, y) as a mapping, we will list all of the unique x-values in one vertical list and all unique y-values in another vertical list. Then, we can use arrows to connect corresponding x- and y-values.
The domain of this relation is the set of all unique x-values and the range is the set of all unique y-values.
Domain:& {-2, -1, 0, 5}
Range:& {- 7, -5, 3, 4}