Big Ideas Math Algebra 1, 2015
BI
Big Ideas Math Algebra 1, 2015 View details
7. Graphing Absolute Value Functions
Continue to next subchapter

Exercise 15 Page 160

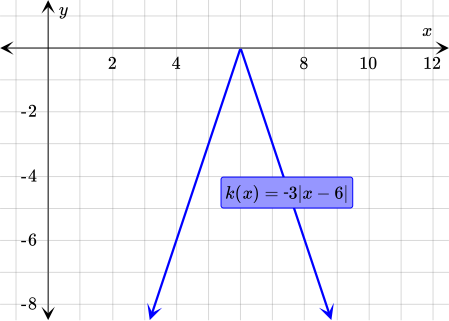
Make a table of values to find points on the graph. Note that the graph of k(x) is a V-shaped graph.

Graph:

Comparison: See solution.

Practice makes perfect

Let's graph k(x) first and then we can compare it to the graph of f(x).

Graphing k(x)

To graph the function without going through the entire process of transforming the parent function, we can make a table of values. Then we only need to plot the ordered pairs that we find.

x -3|x-6| Simplify k(x)
4 -3| 4-6| -3|-2| -6
5 -3| 5-6| -3|-1| -3
6 -3| 6-6| -3|0| 0
7 -3| 7-6| -3|1| -3
8 -3| 8-6| -3|2| -6
We plot these ordered pairs on a coordinate plane and connect them to get the graph of k(x). Note that k(x) is a transformation of the graph of the parent function y=|x|, which is V-shaped. Therefore, k(x) will also be a V-shaped graph.

Now that we have graphed our function, we can move on to comparing it to f(x).

Comparing the Functions

To compare the graph of k(x) to the graph of f(x)=|x-6|, let's first draw f(x). Note that f(x) is a horizontal translation 6 units right of the graph of y=|x|.

Now that we have drawn f(x), we can compare it to k(x).

As we can see, the graph of k(x) is a vertical stretch of the graph f(x) by a factor of 3 and a reflection in the x-axis.